I want reliable data
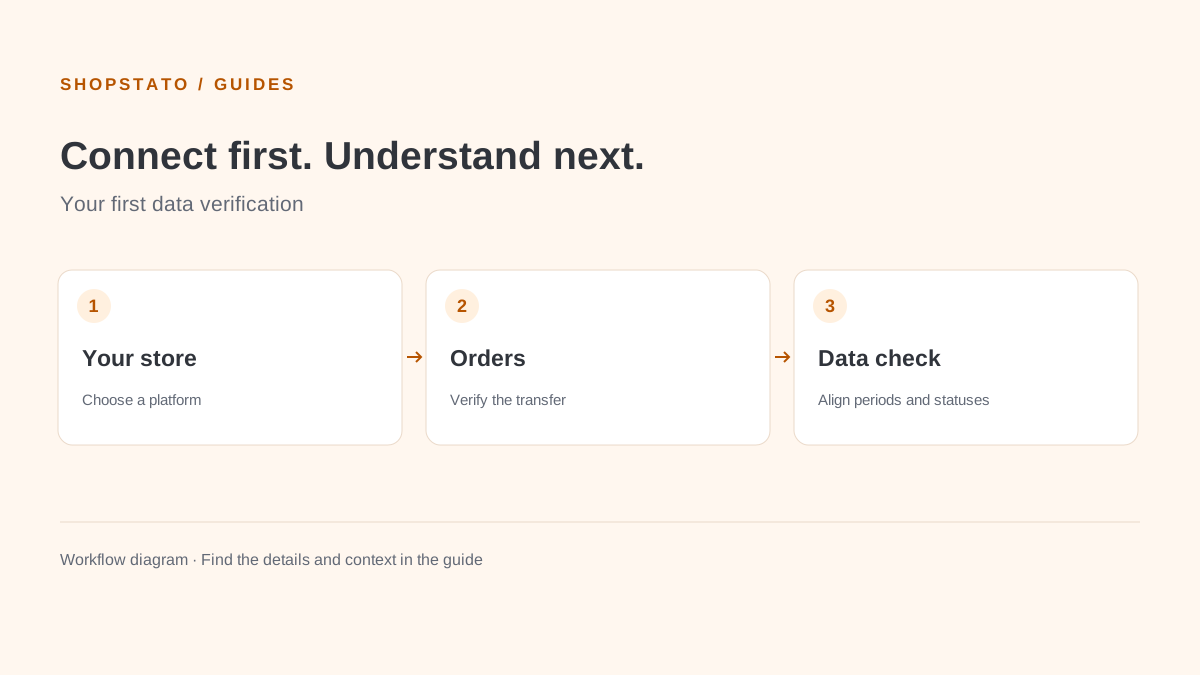
Connections, correct imports and your first checks.
Less guesswork. More understanding.
From your first import to sales forecasting. Understand what each report means, how to set it up and what to do next.
Find your guide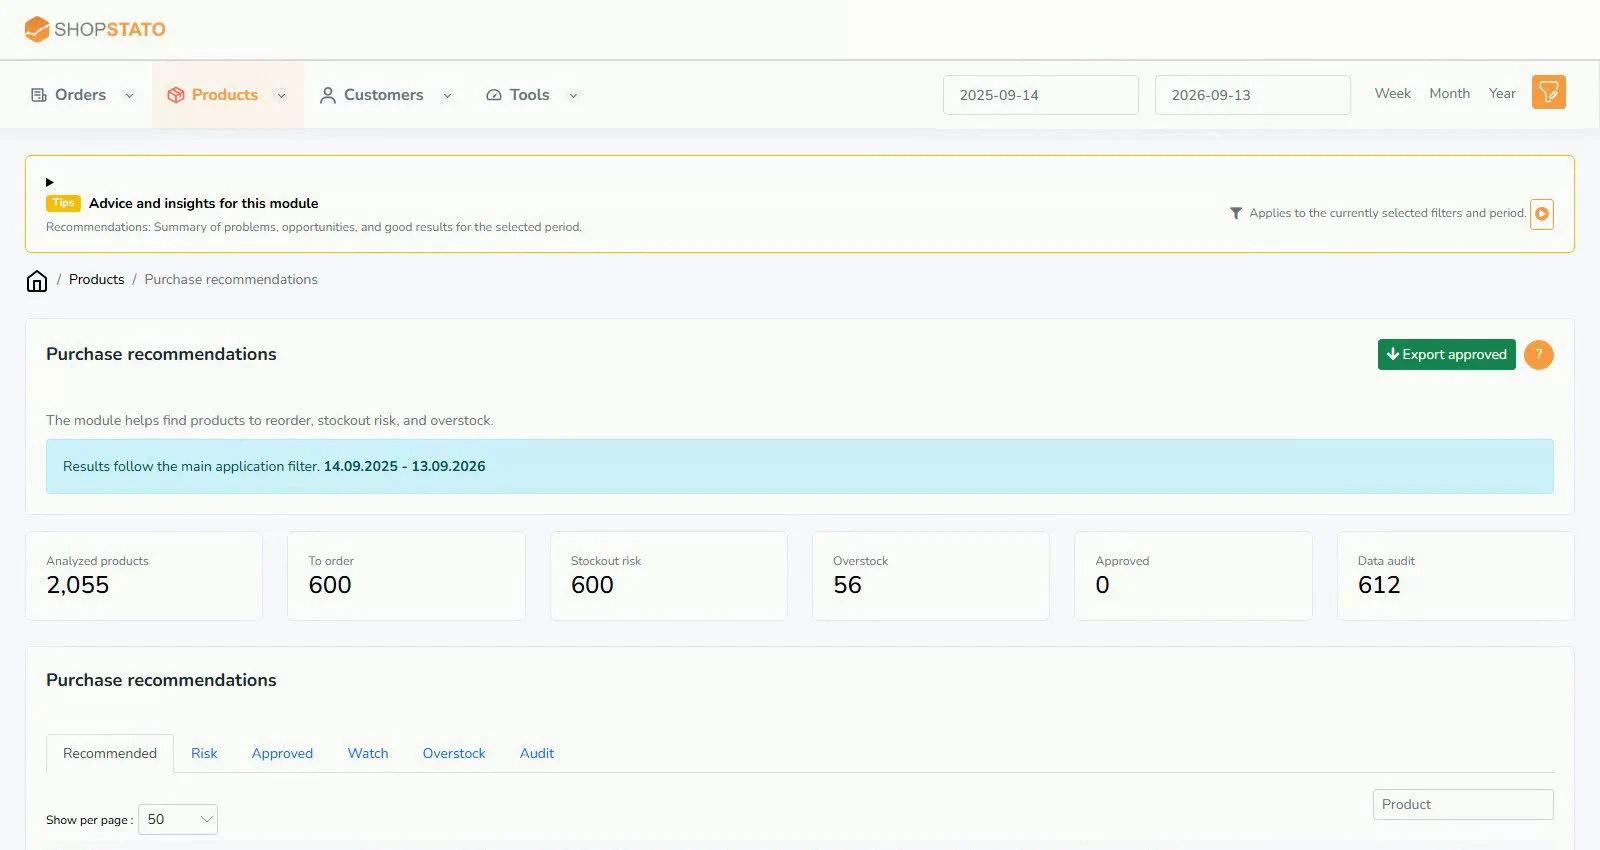 What should you reorder, and what should stay on the shelf?Read the guide
Choose what matters to you
Connections, correct imports and your first checks.
Find key products and inventory that is not moving.
Understand purchase history and choose useful segments.
Turn current data into specific priorities.
The whole library in one place
Connect your store, configure your account and check the first imported orders. Incomplete settings can lead to empty or inaccurate reports.
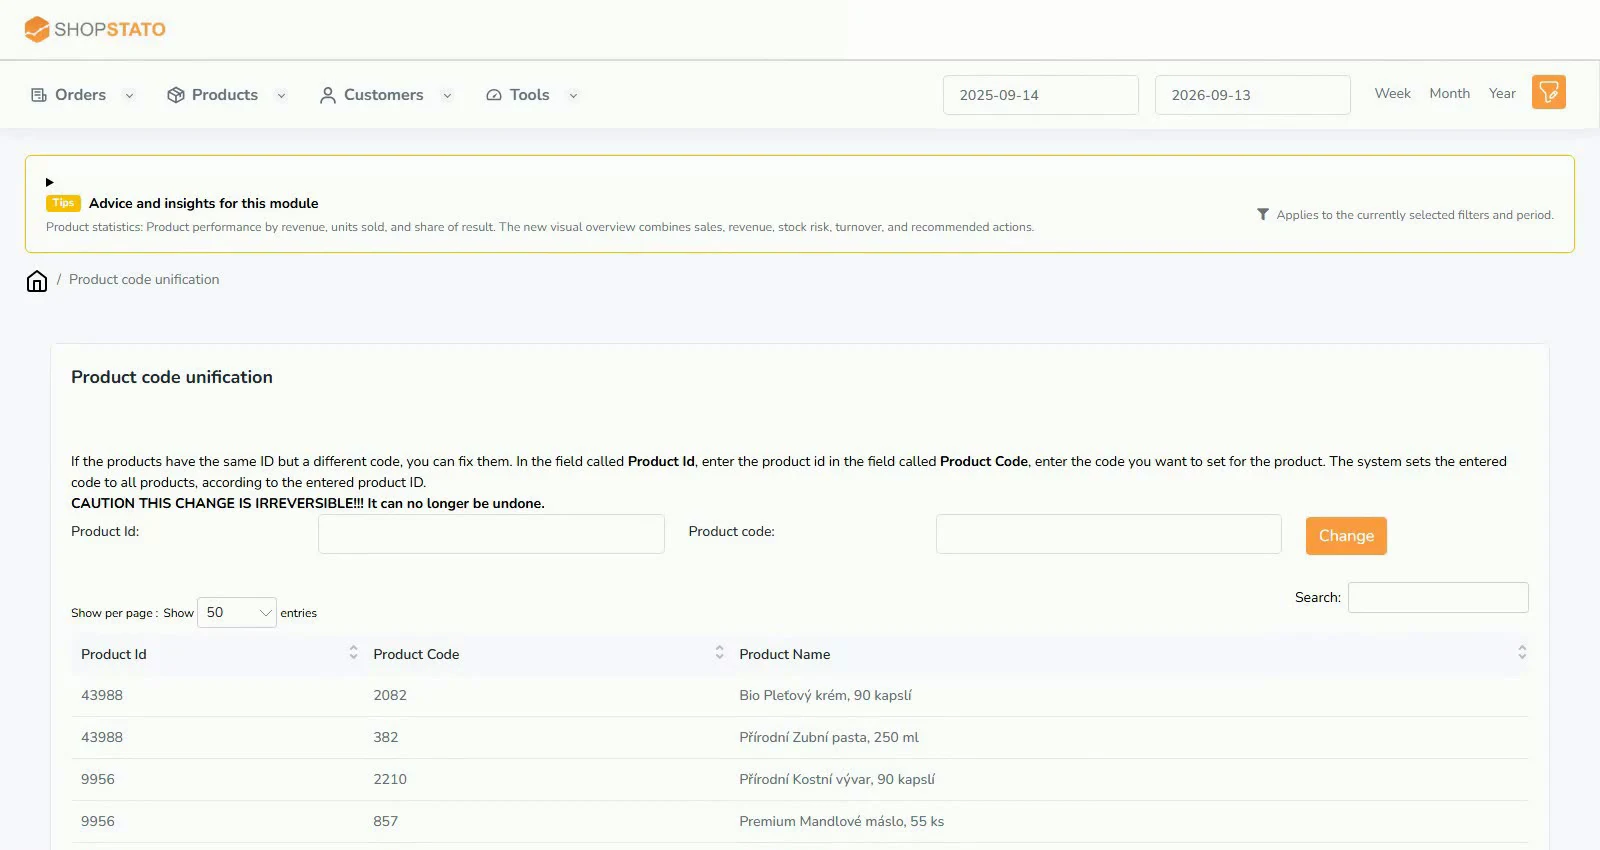
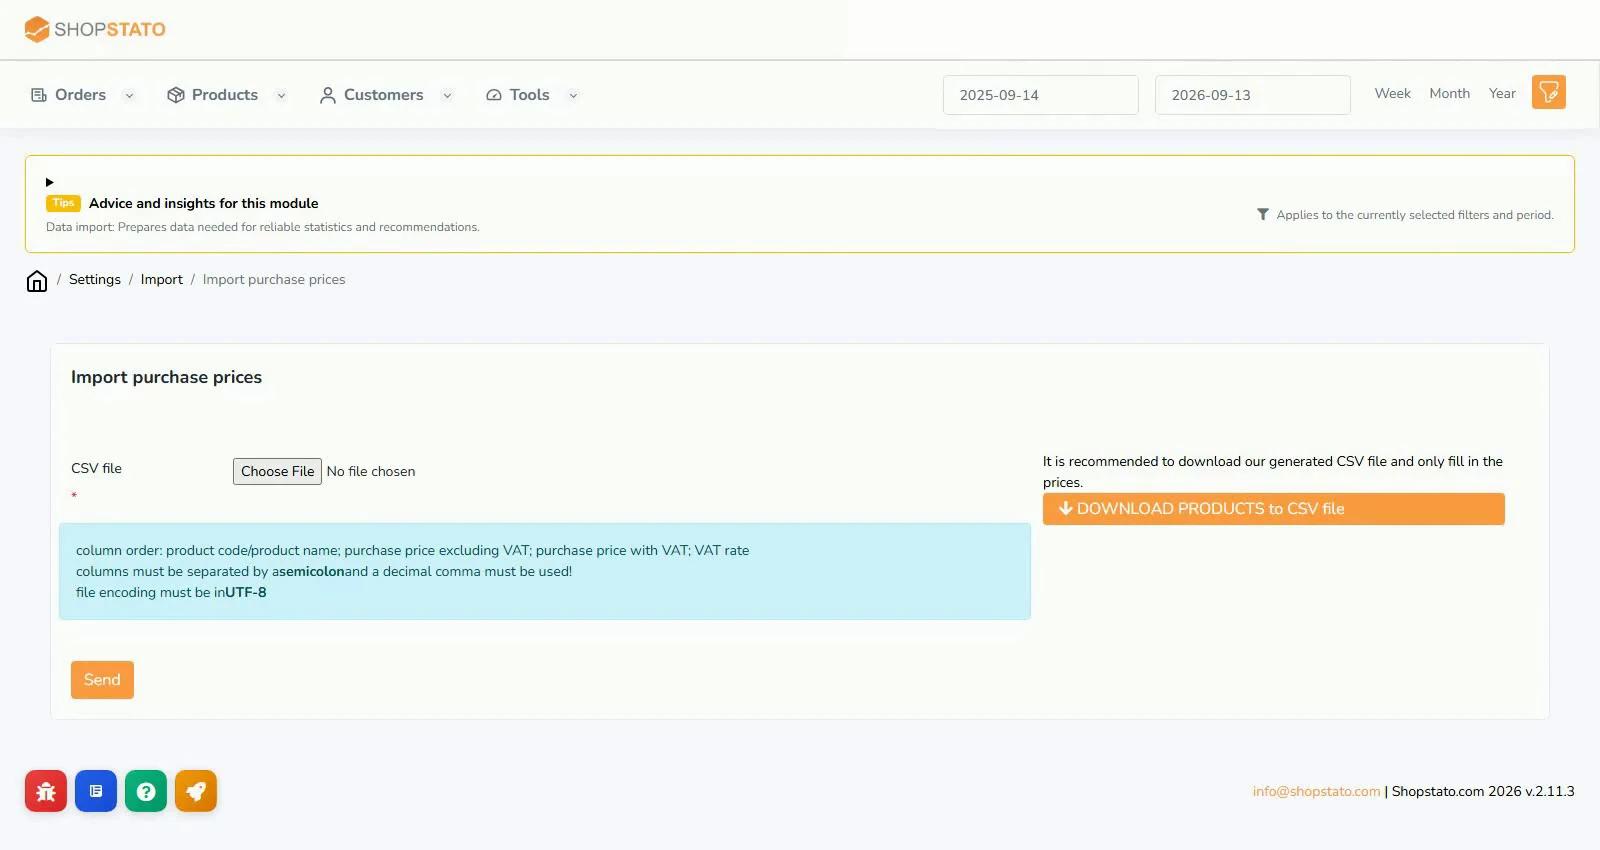
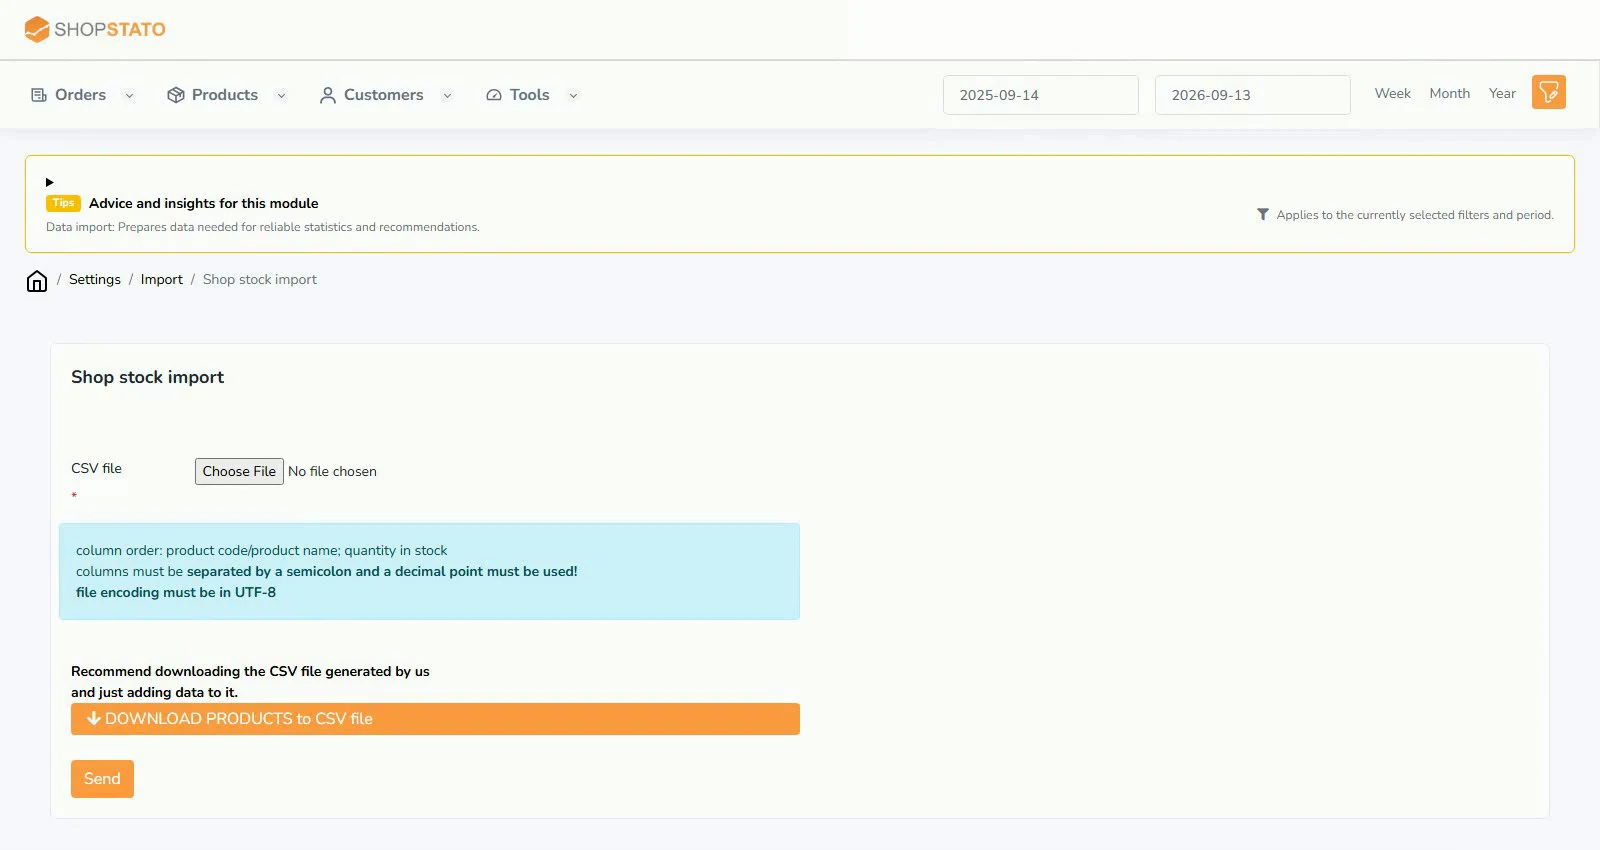
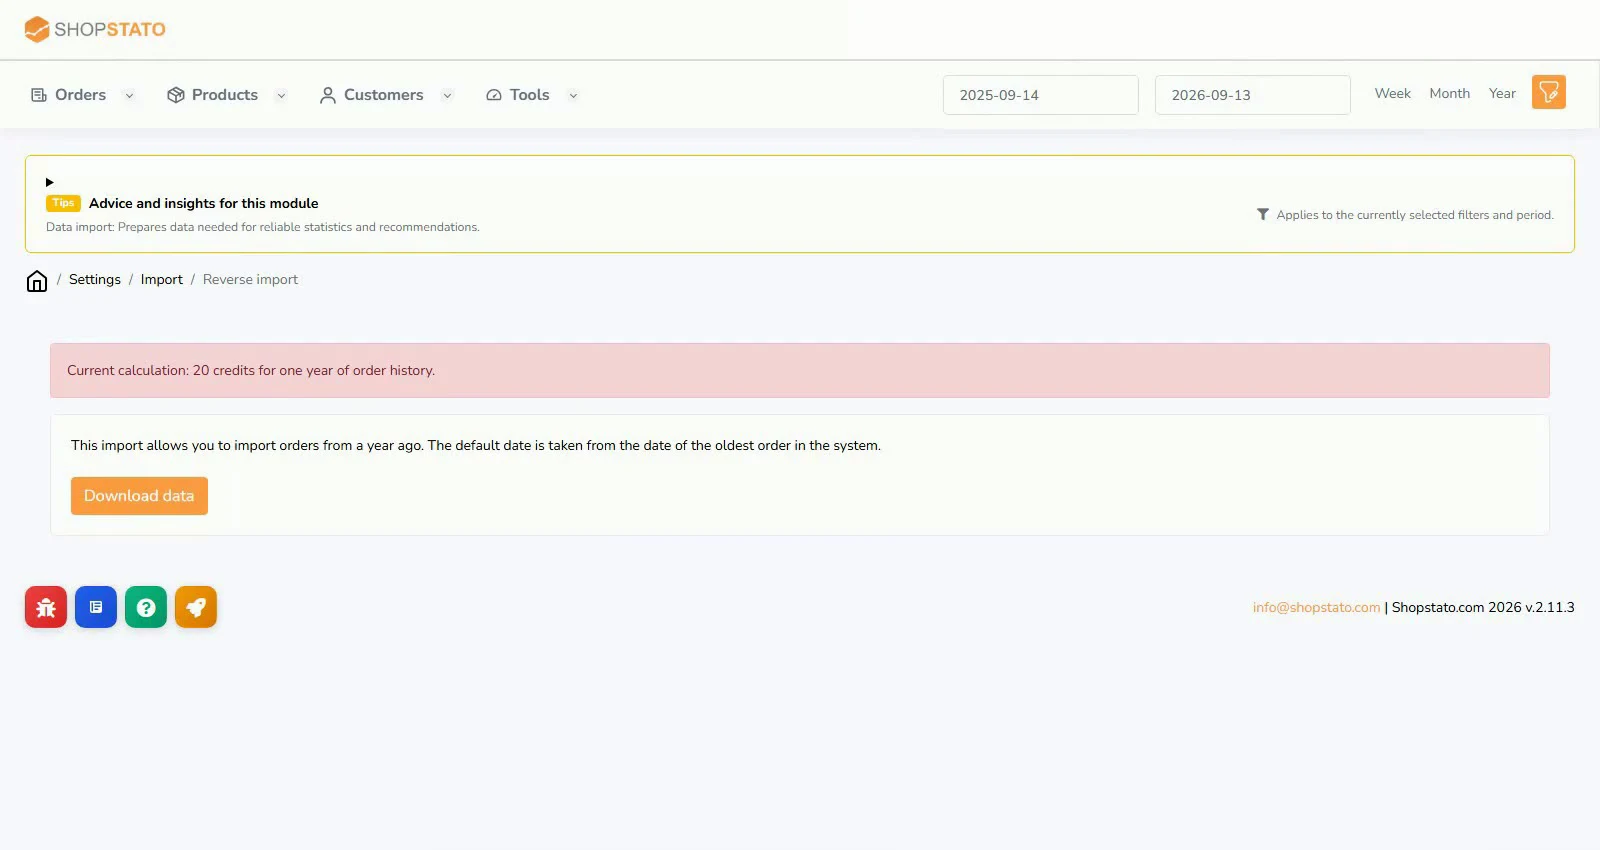
Bring in purchase prices, inventory and order history. After a feed or API change, check the result over a short period first.
Email reports are a quick worklist for review. Check product details and current data before acting on an alert.
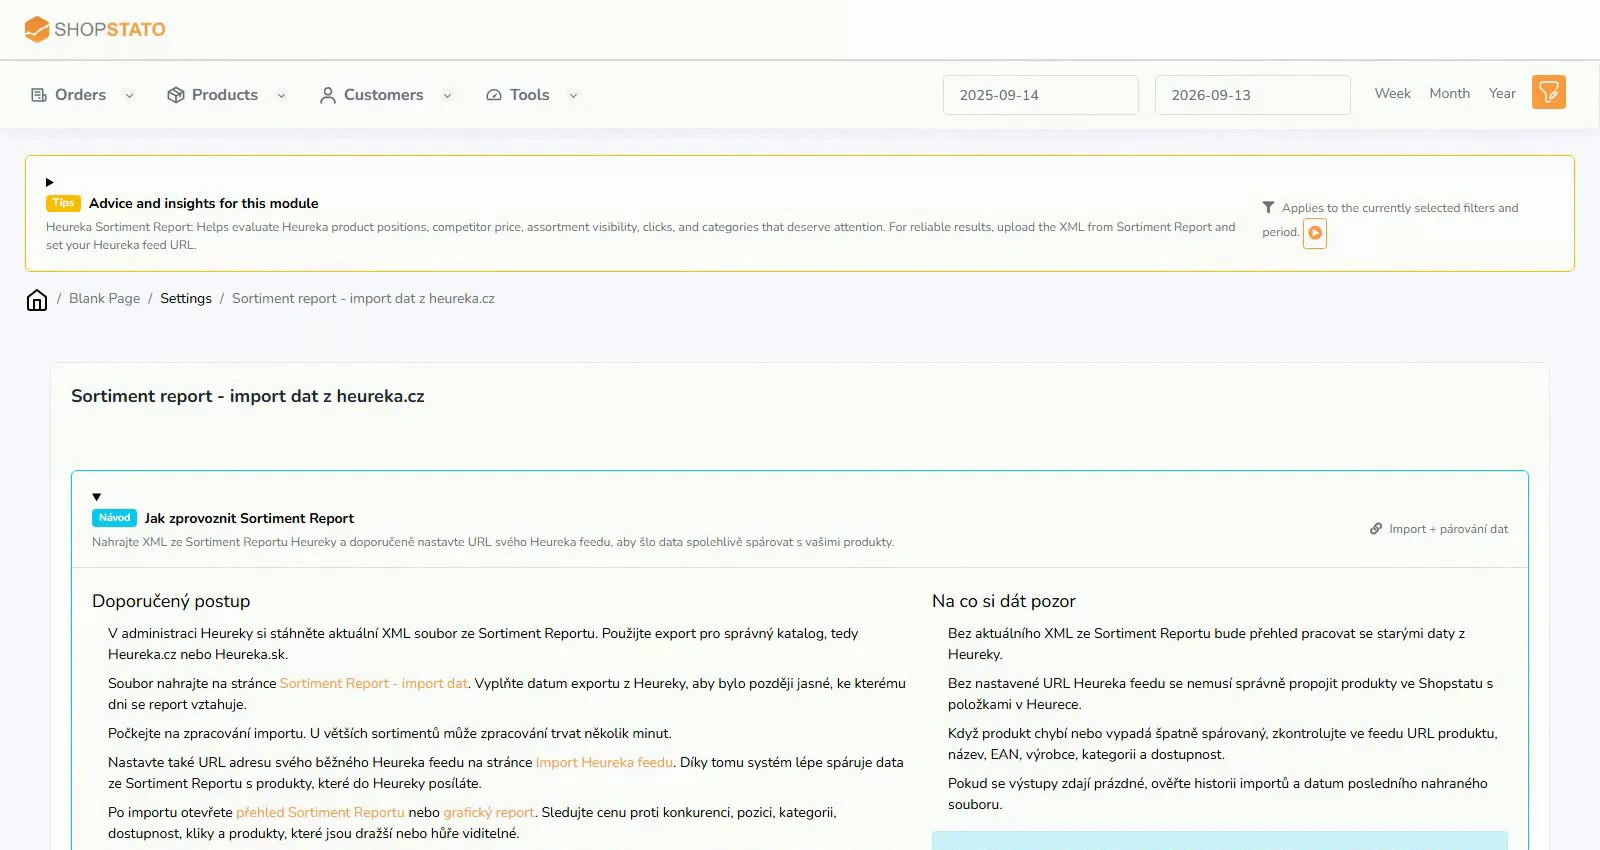 Assortment Report: turn an XML export into a market overview2 min read · 1 screenshot · video
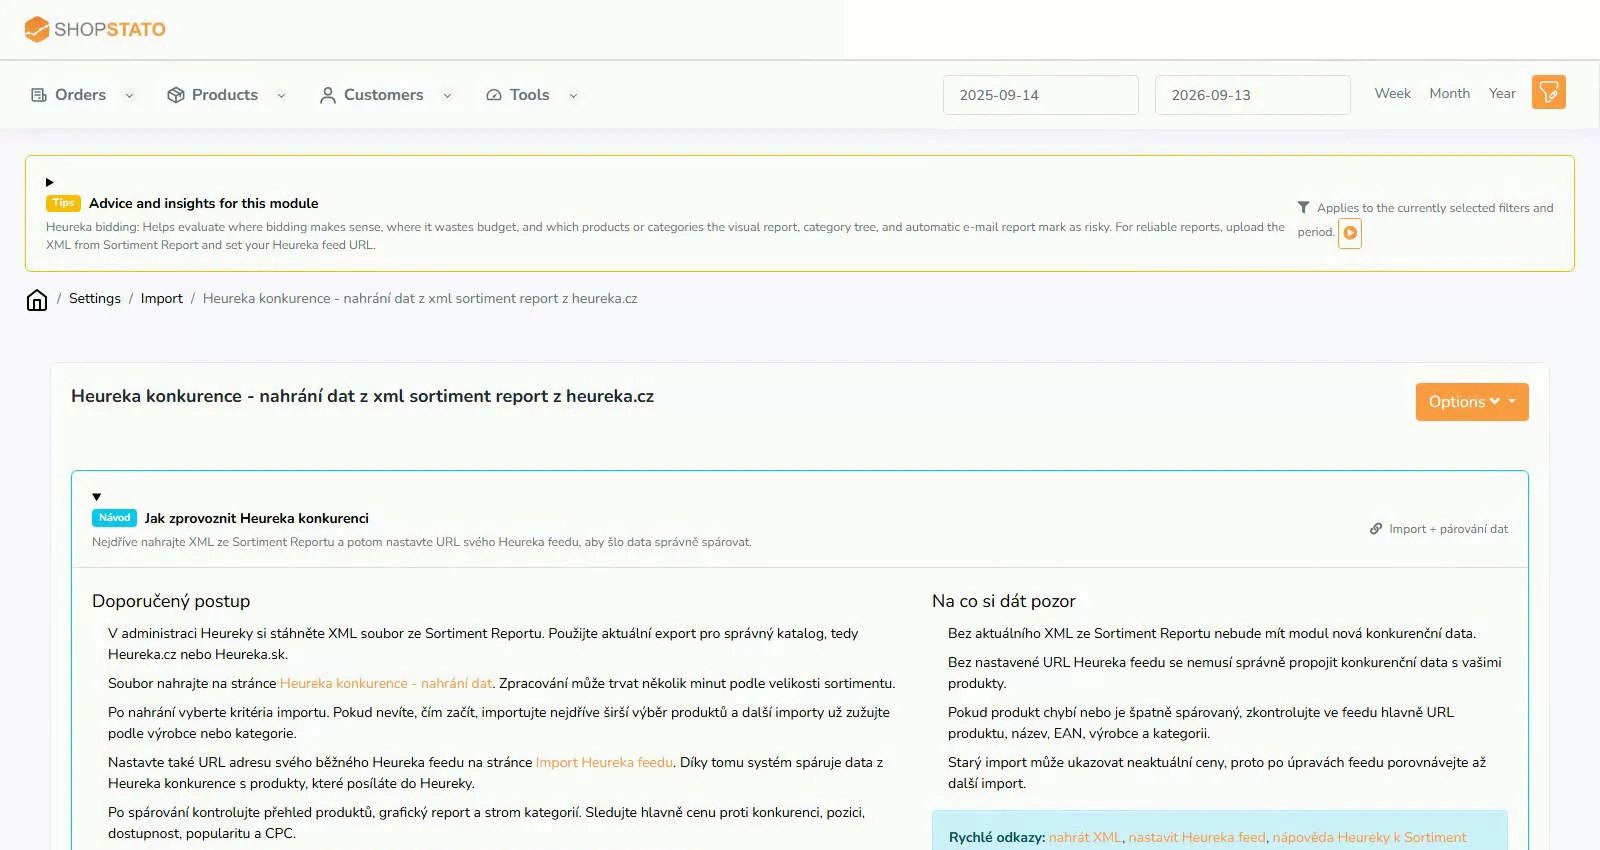 Heureka competition: prepare data for price comparisons2 min read · 1 screenshot · video
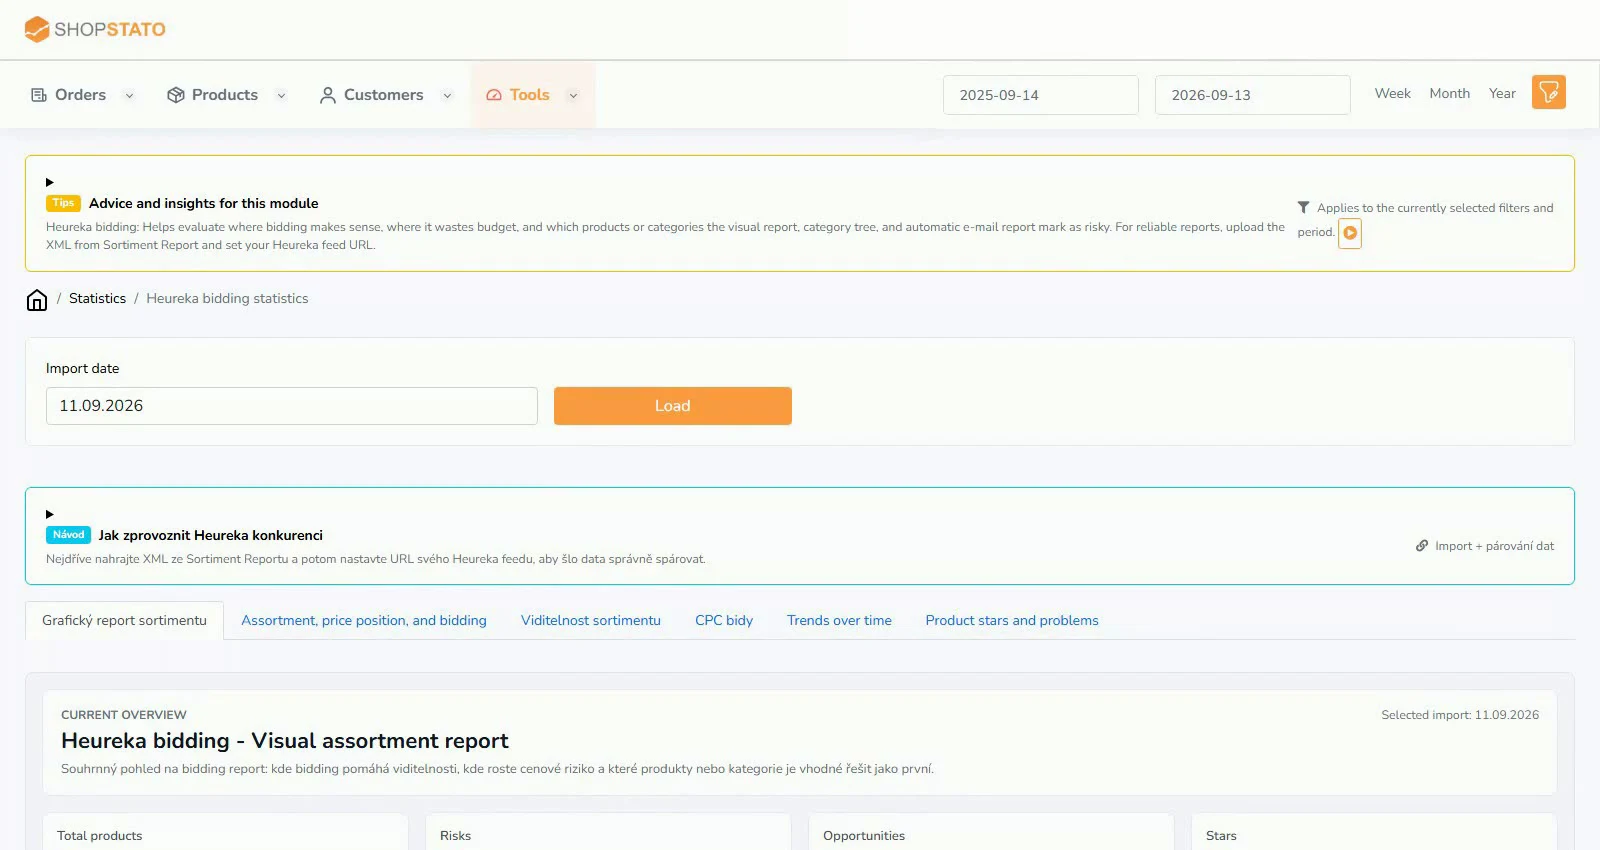 Heureka charts: where to start reviewing your assortment2 min read · 2 screenshots · video
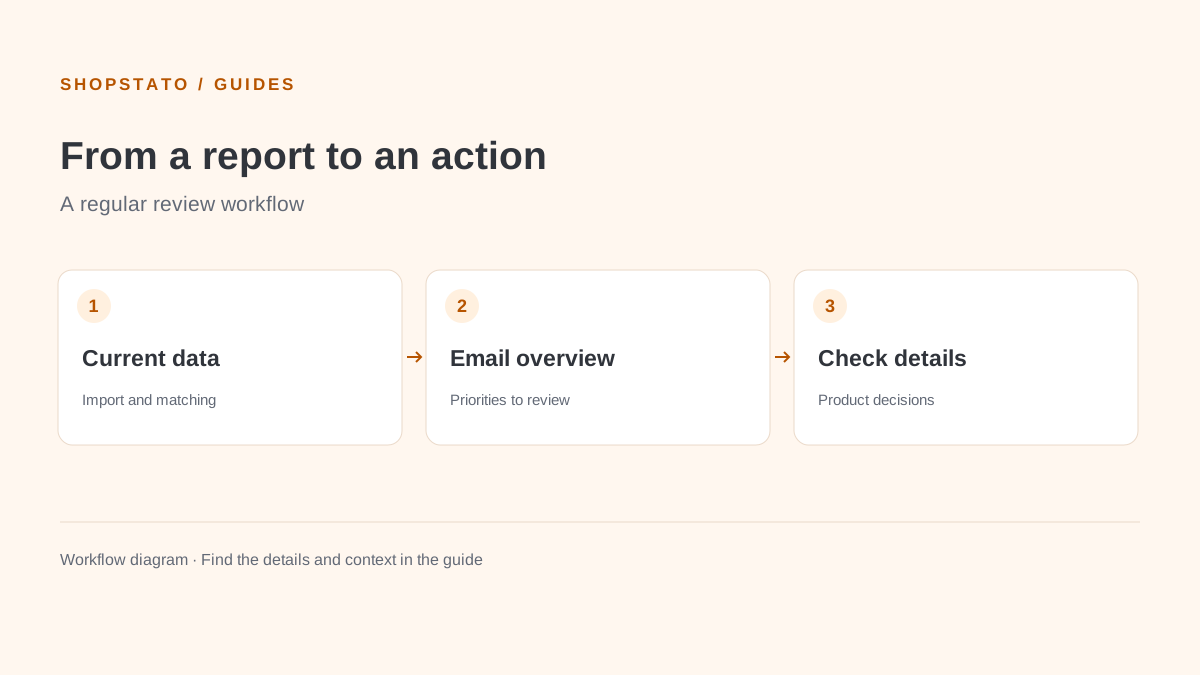 Heureka by email: review meaningful changes in time2 min readPreset Heureka reports: understand what you receive and why2 min read
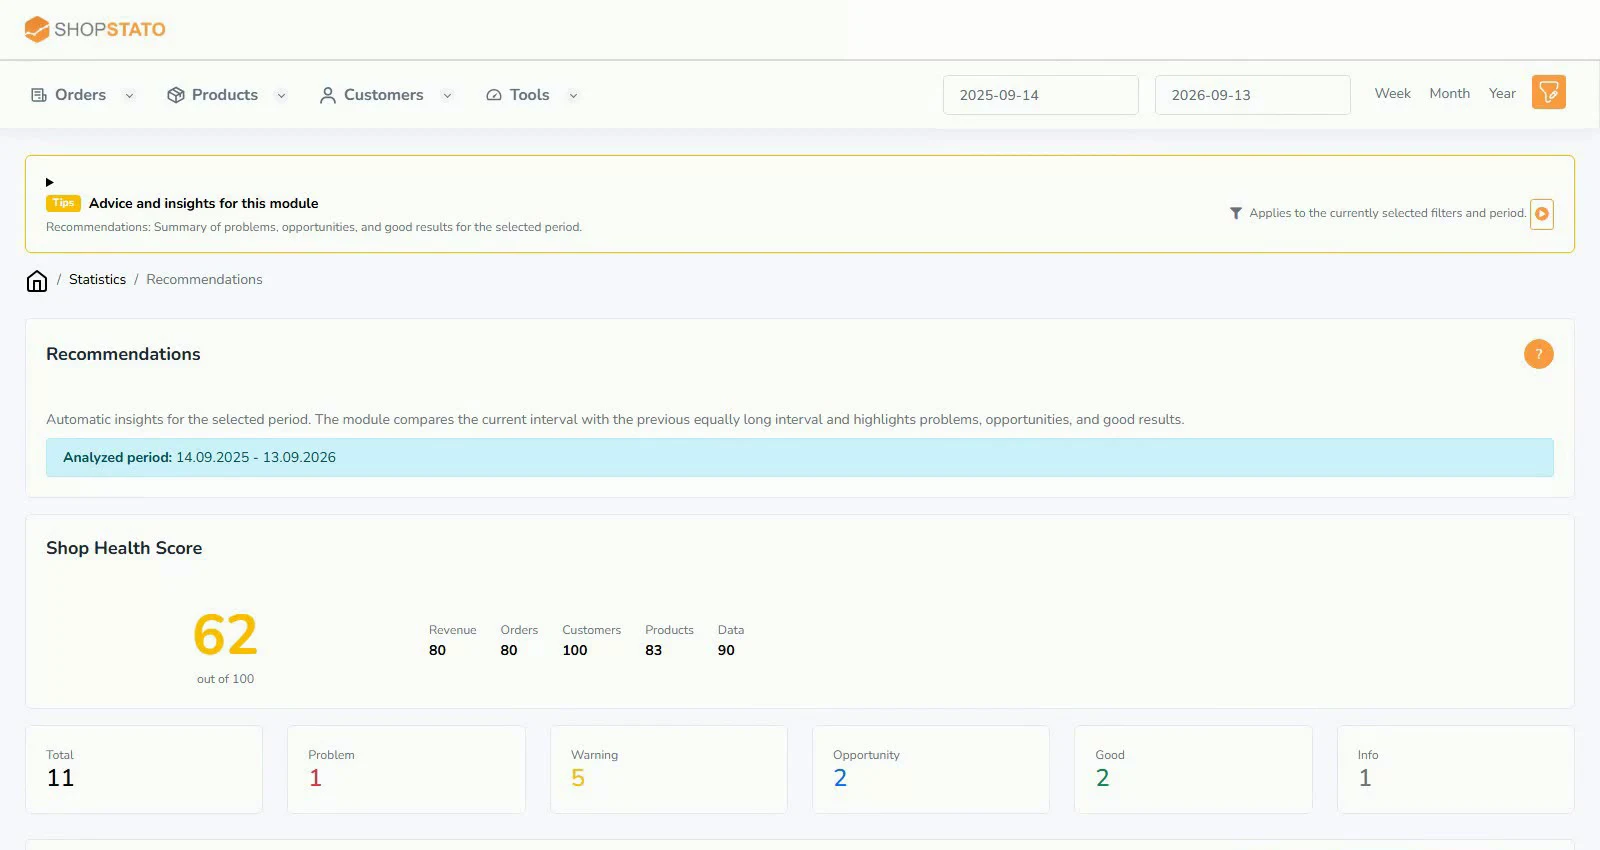 Weekly insights: turn alerts into a plan for next week2 min read · 1 screenshot · video
Understand order value, basket size, product combinations and the parameters behind your assortment performance.
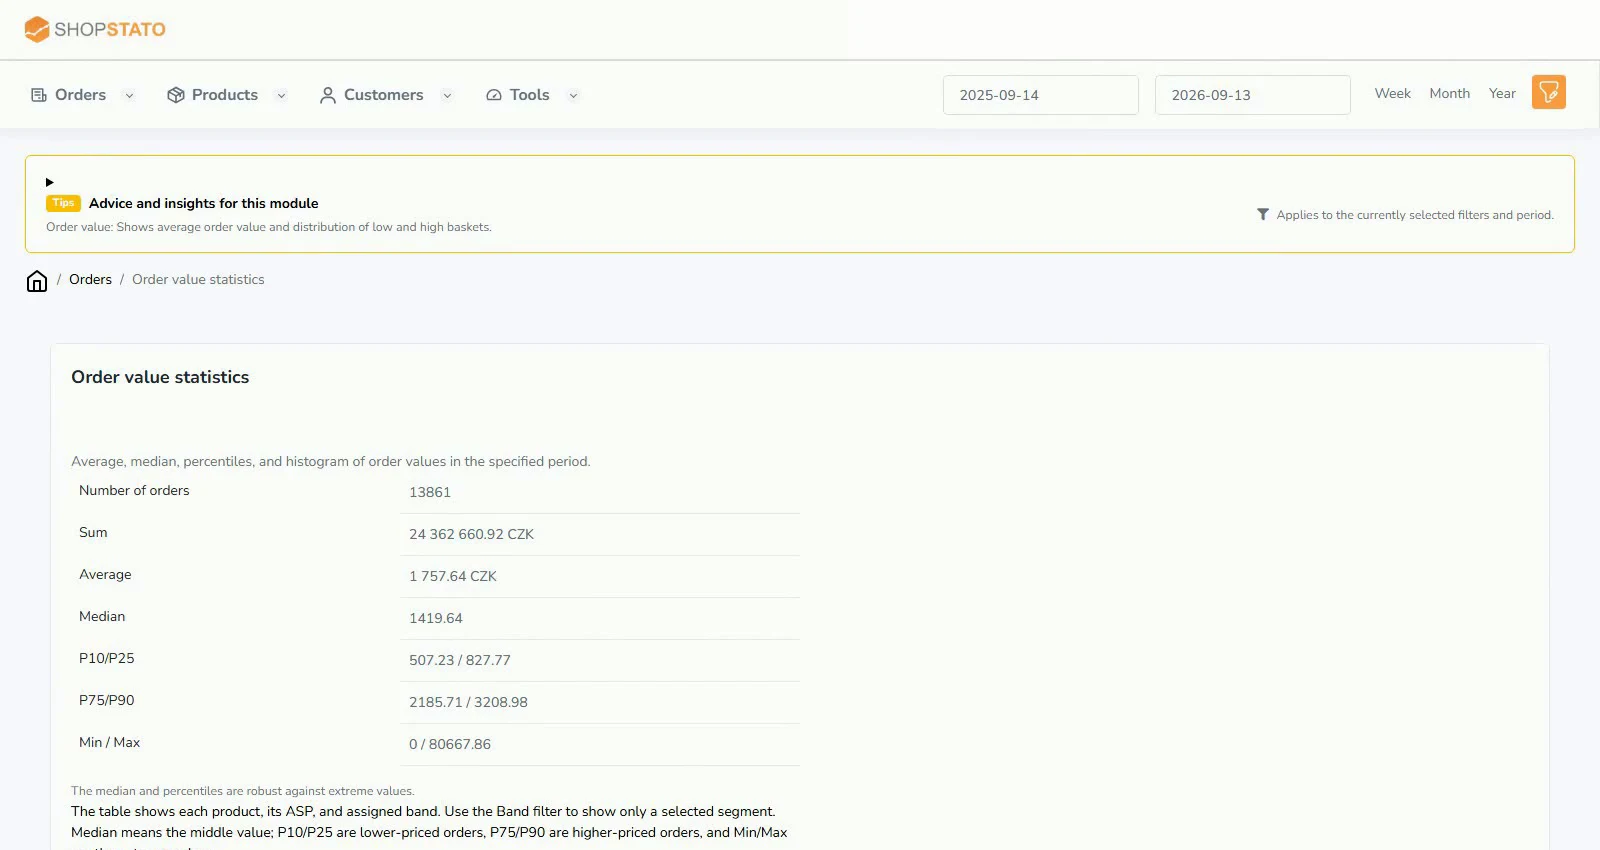 Order value: look beyond the average2 min read · 1 screenshot · video
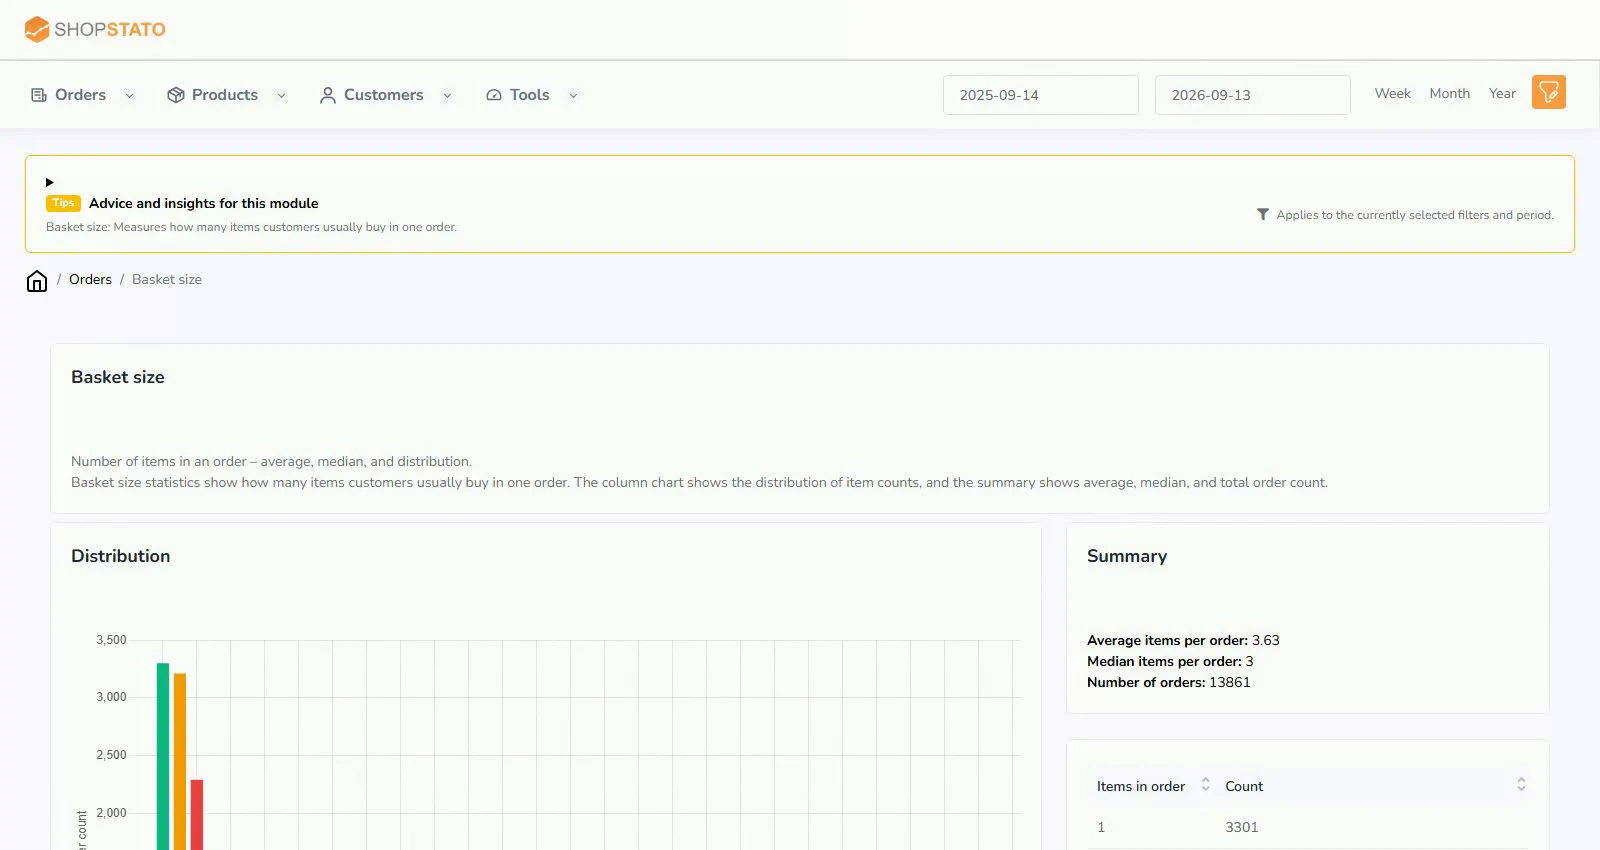 Basket size: how many items customers actually buy2 min read · 1 screenshot · video
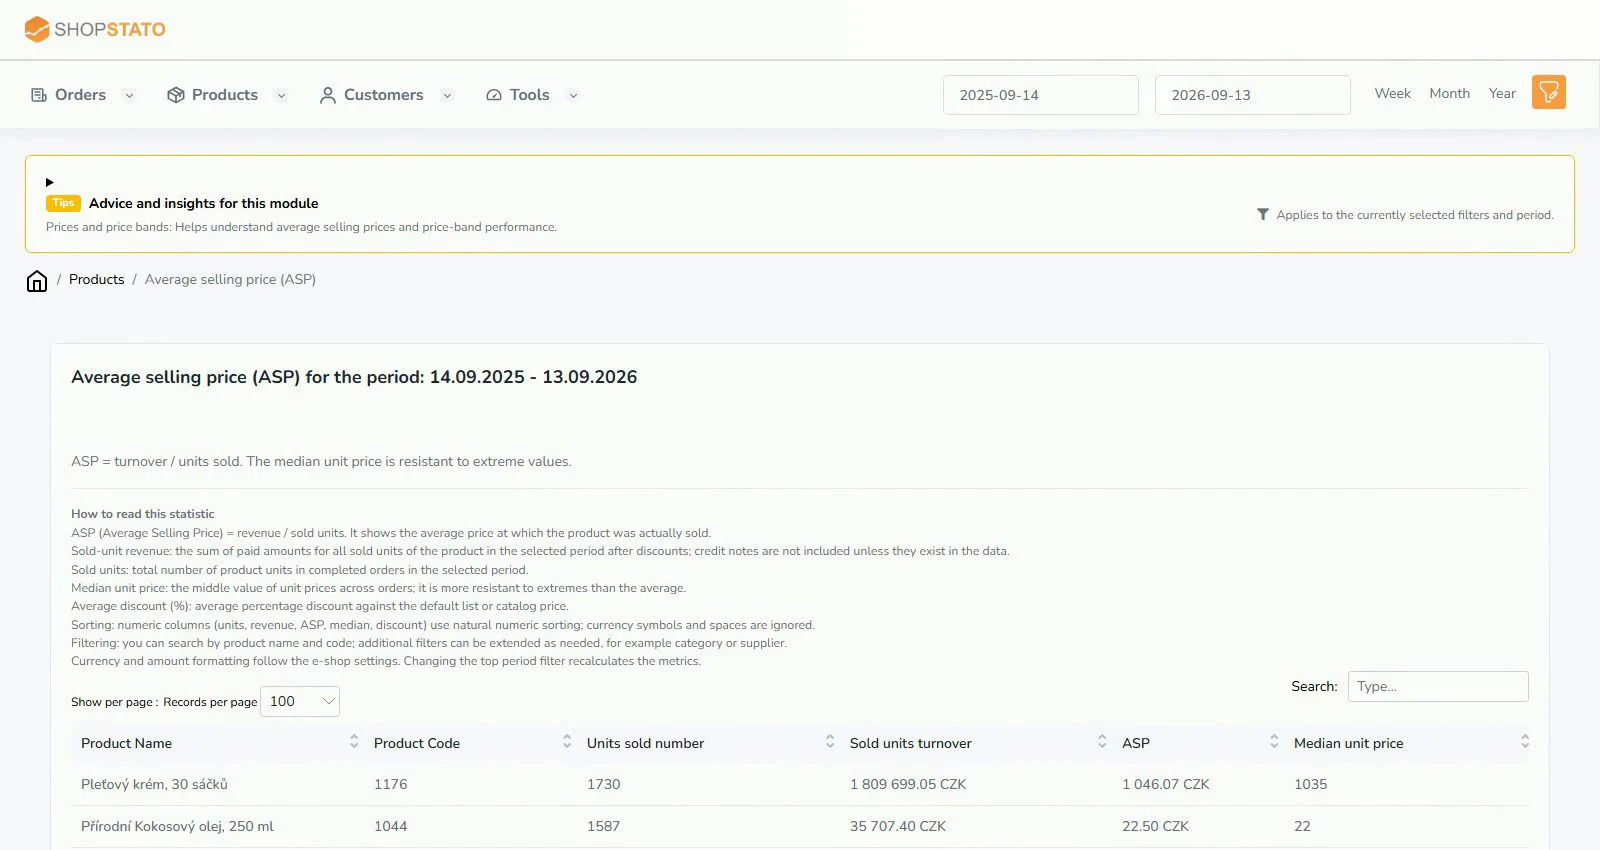 Average selling price (ASP): separate price from quantity2 min read · 1 screenshot · video
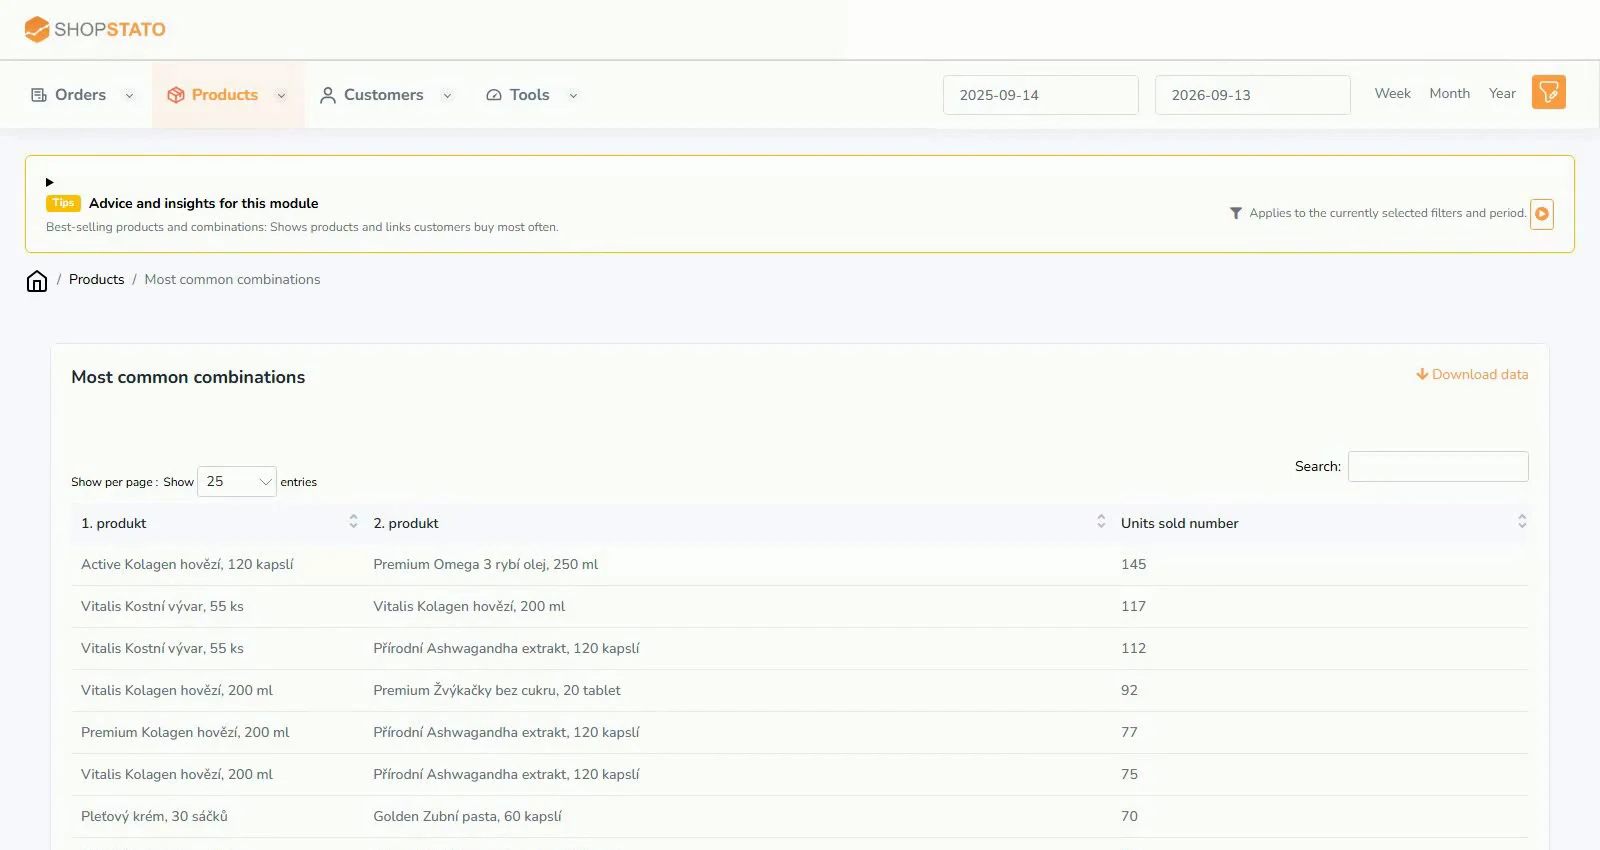 Attach rate and cross-sell: discover products that belong together2 min read · 1 screenshot · video
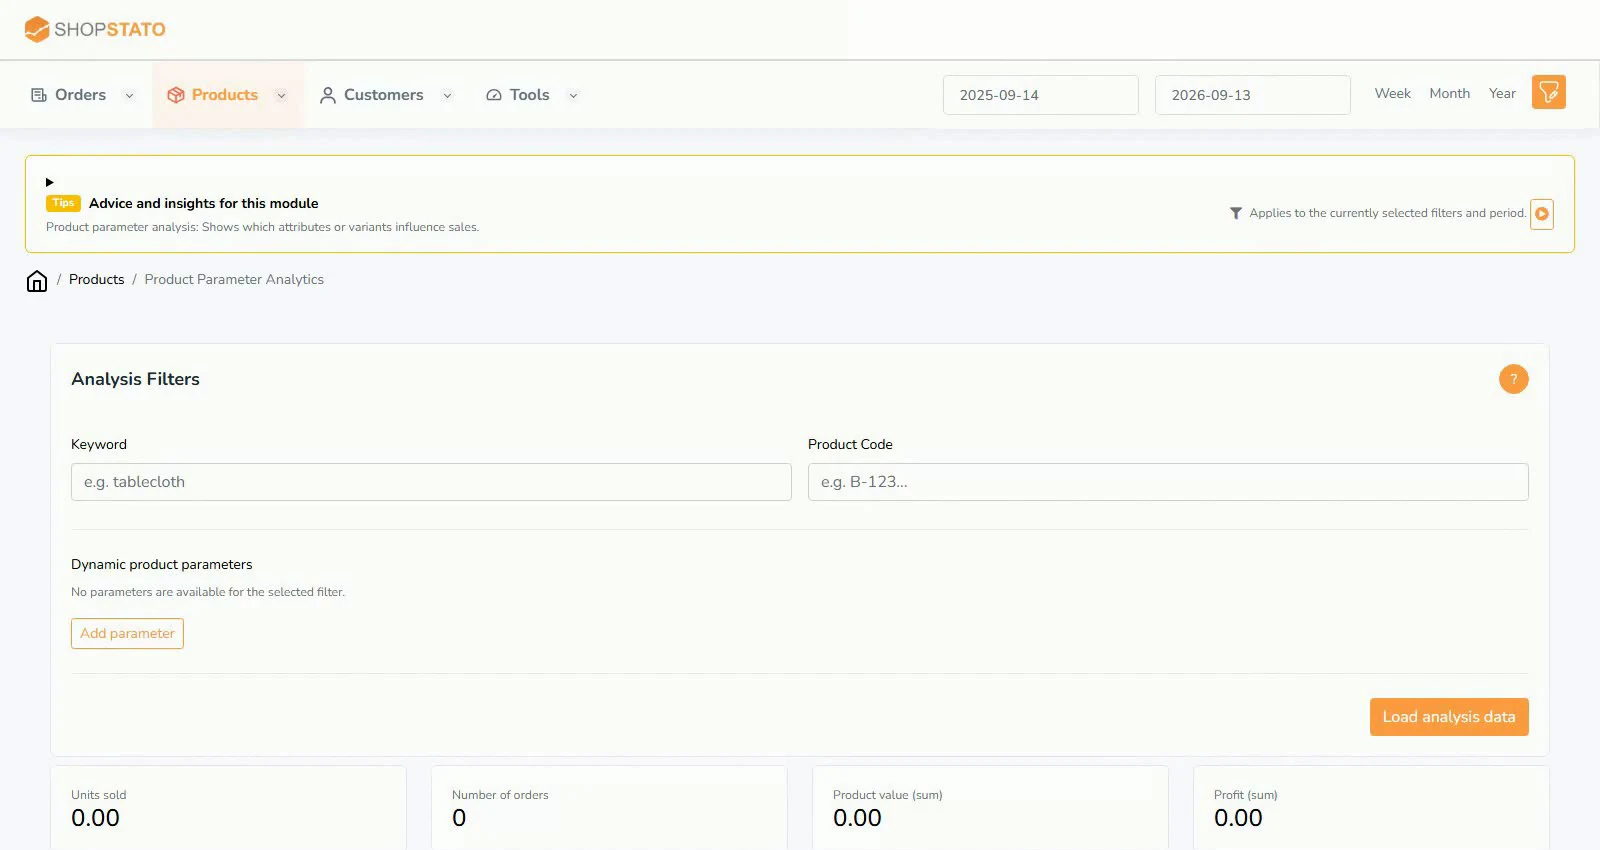 Product parameters: find the colours, sizes and variants that sell2 min read · 1 screenshot · video
Follow retention, purchase behaviour and churn risk. Compare equivalent periods and customer groups.
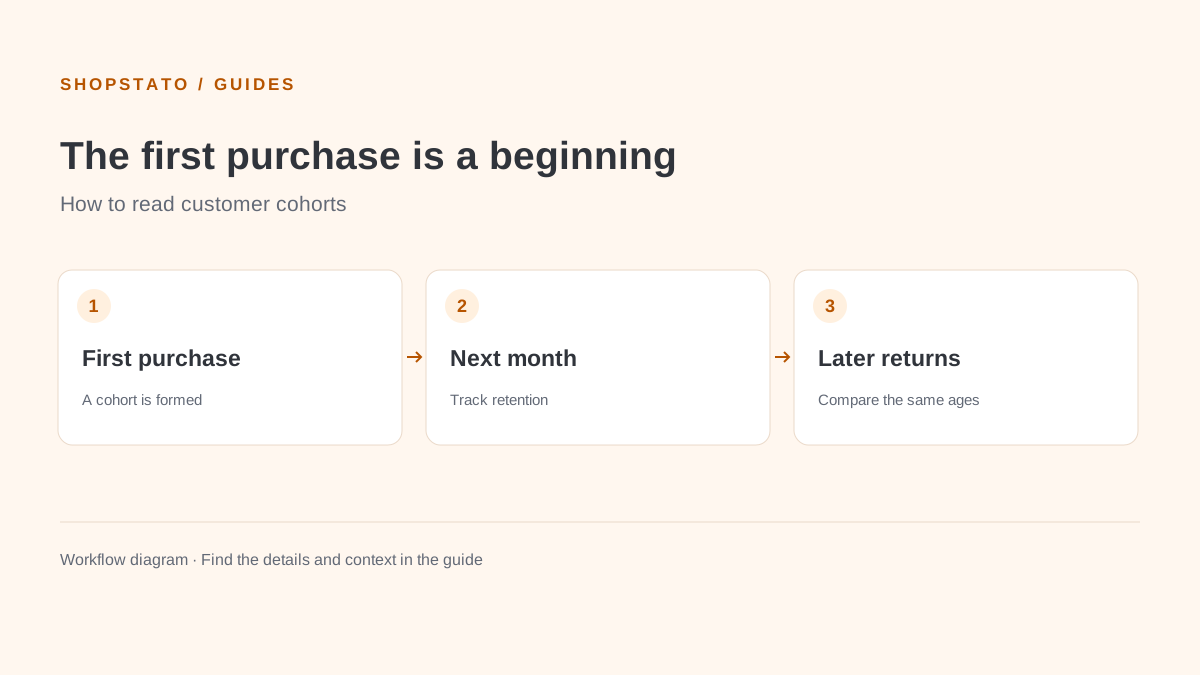 Customer cohorts: do people return after their first purchase?2 min read
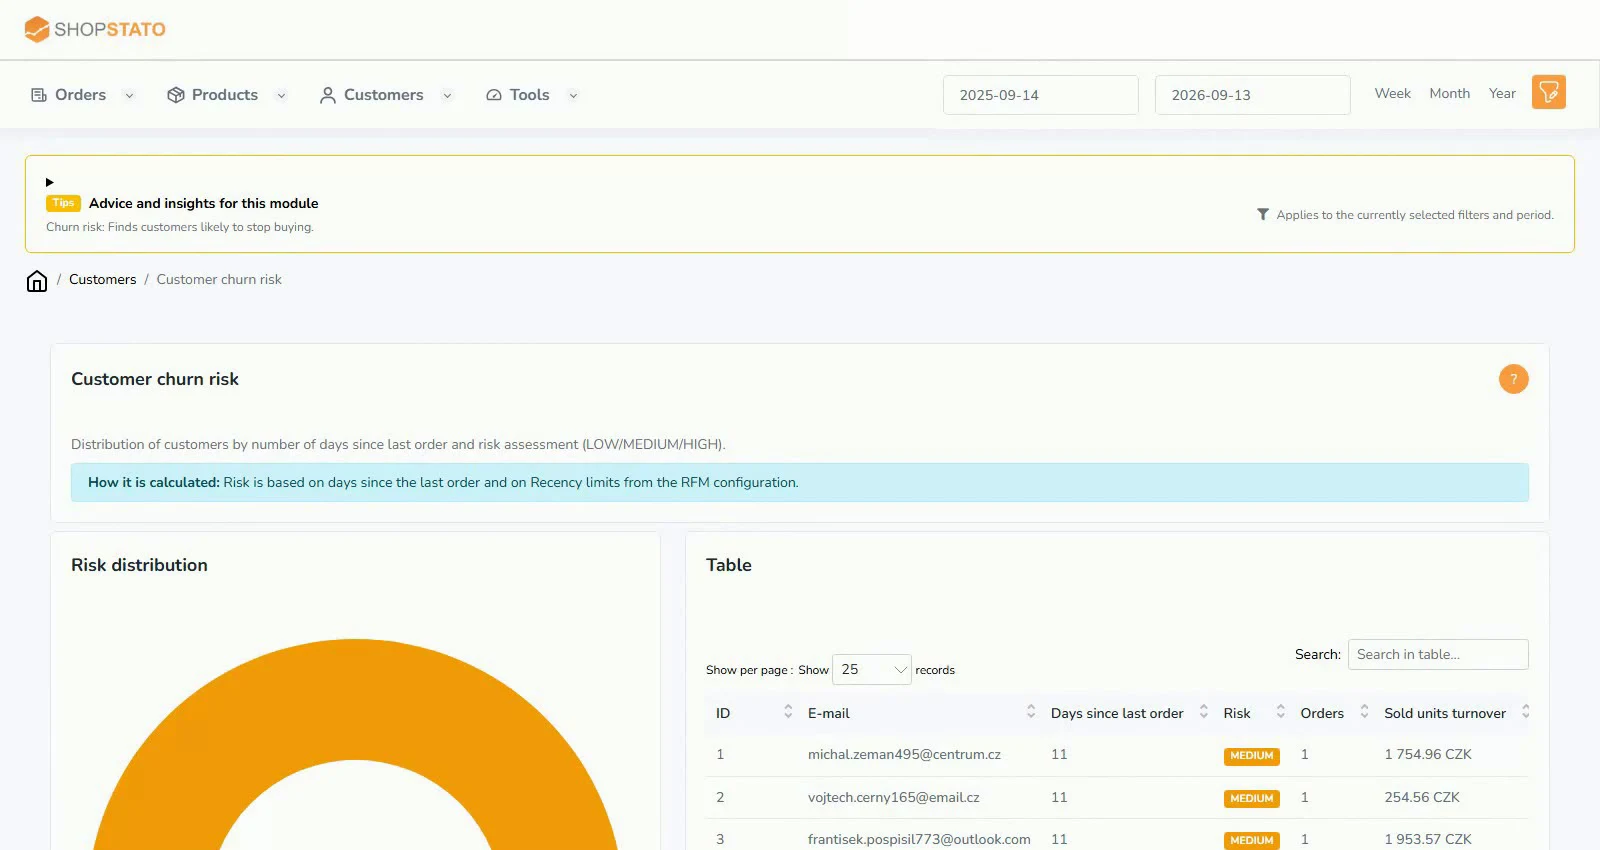 Churn risk: spot customers who are stopping coming back2 min read · 1 screenshot · video
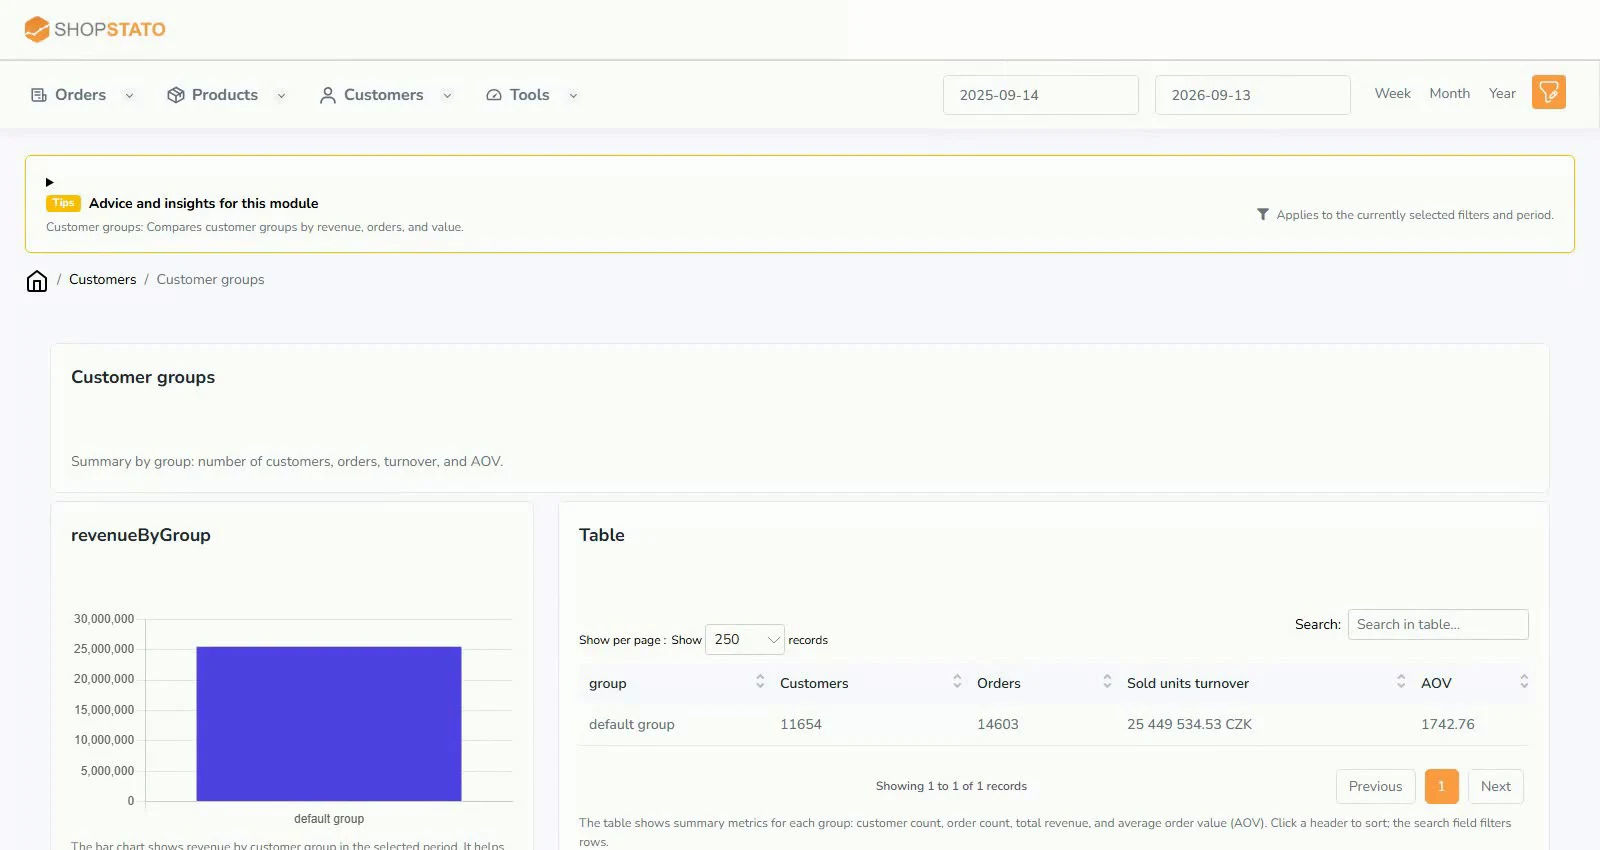 Customer groups: compare the contribution of each segment2 min read · 1 screenshot · video
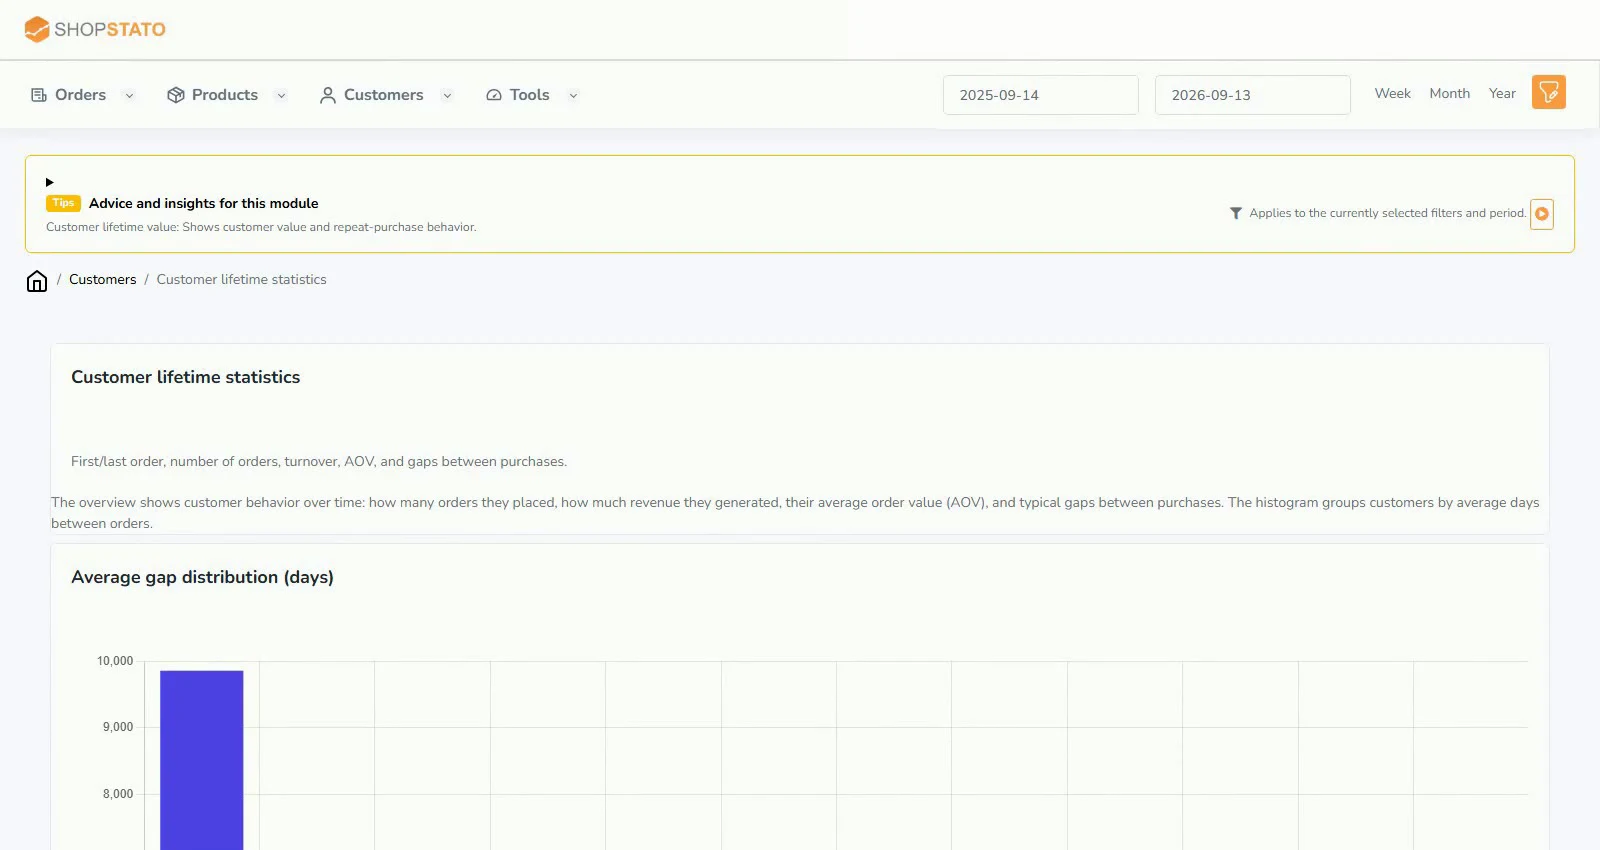 Customer lifetime statistics: see the whole relationship2 min read · 1 screenshot · video
Review customer shipping and payment choices, and understand service credit usage. Each report concerns a different part of the business.
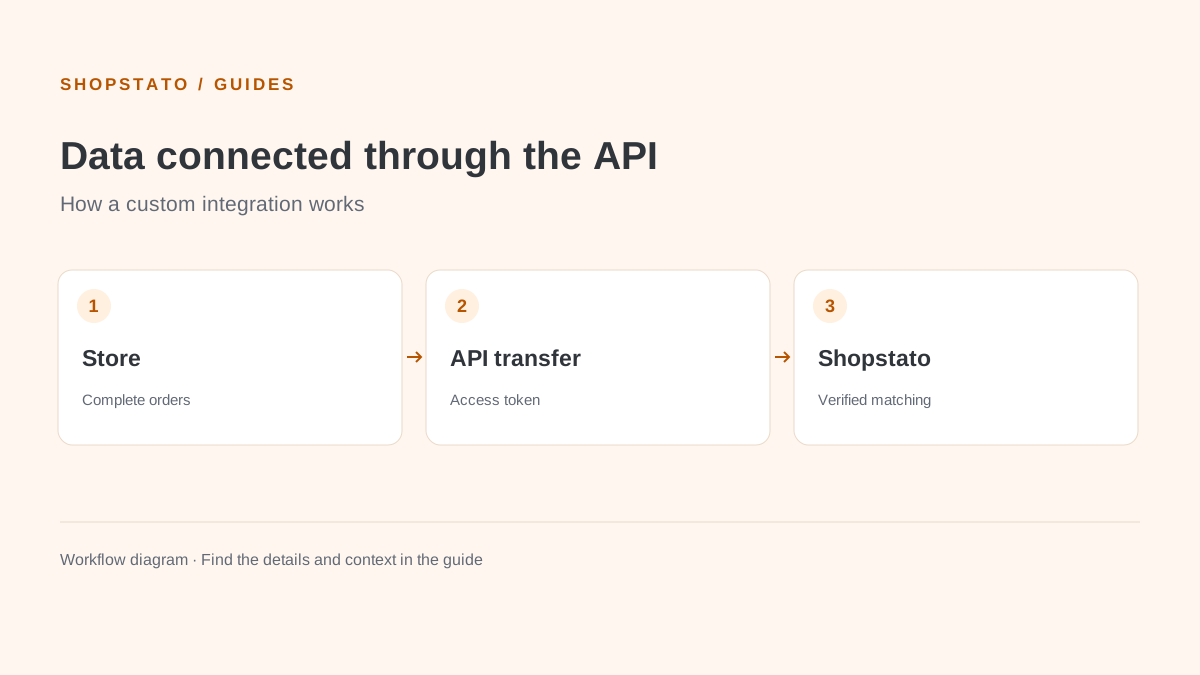
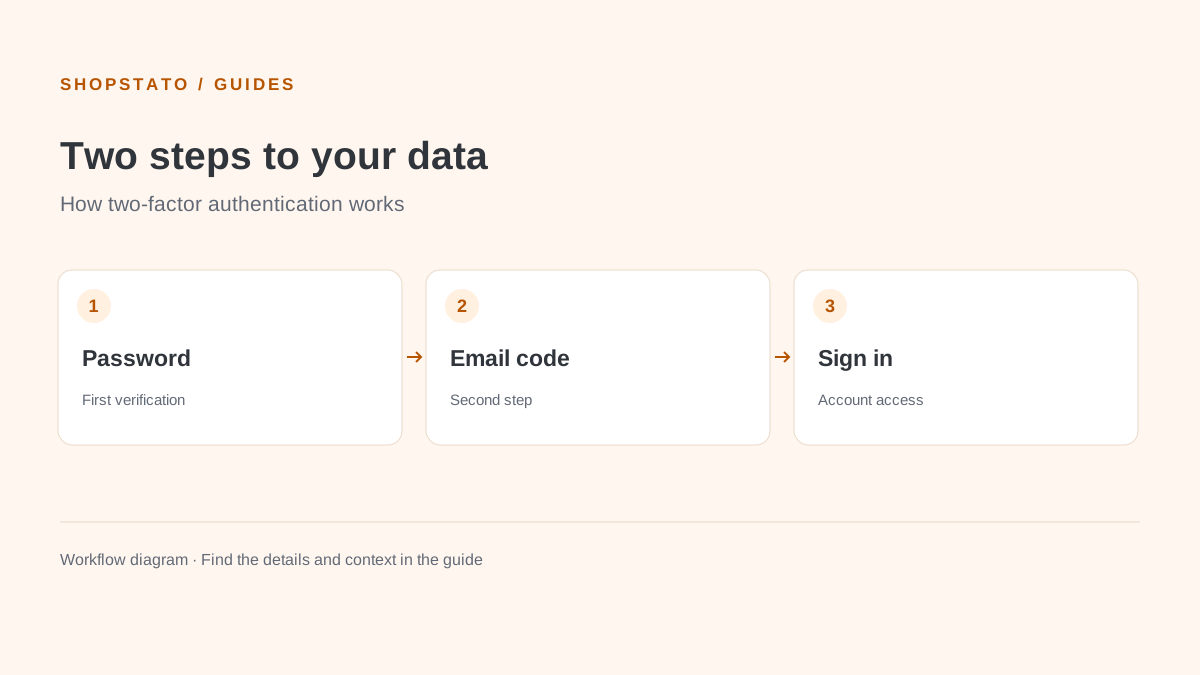
Export data or connect it to another system, while keeping access tokens and customer data protected.
Practical uses of each module, with required inputs, explanations, screenshots and application links.
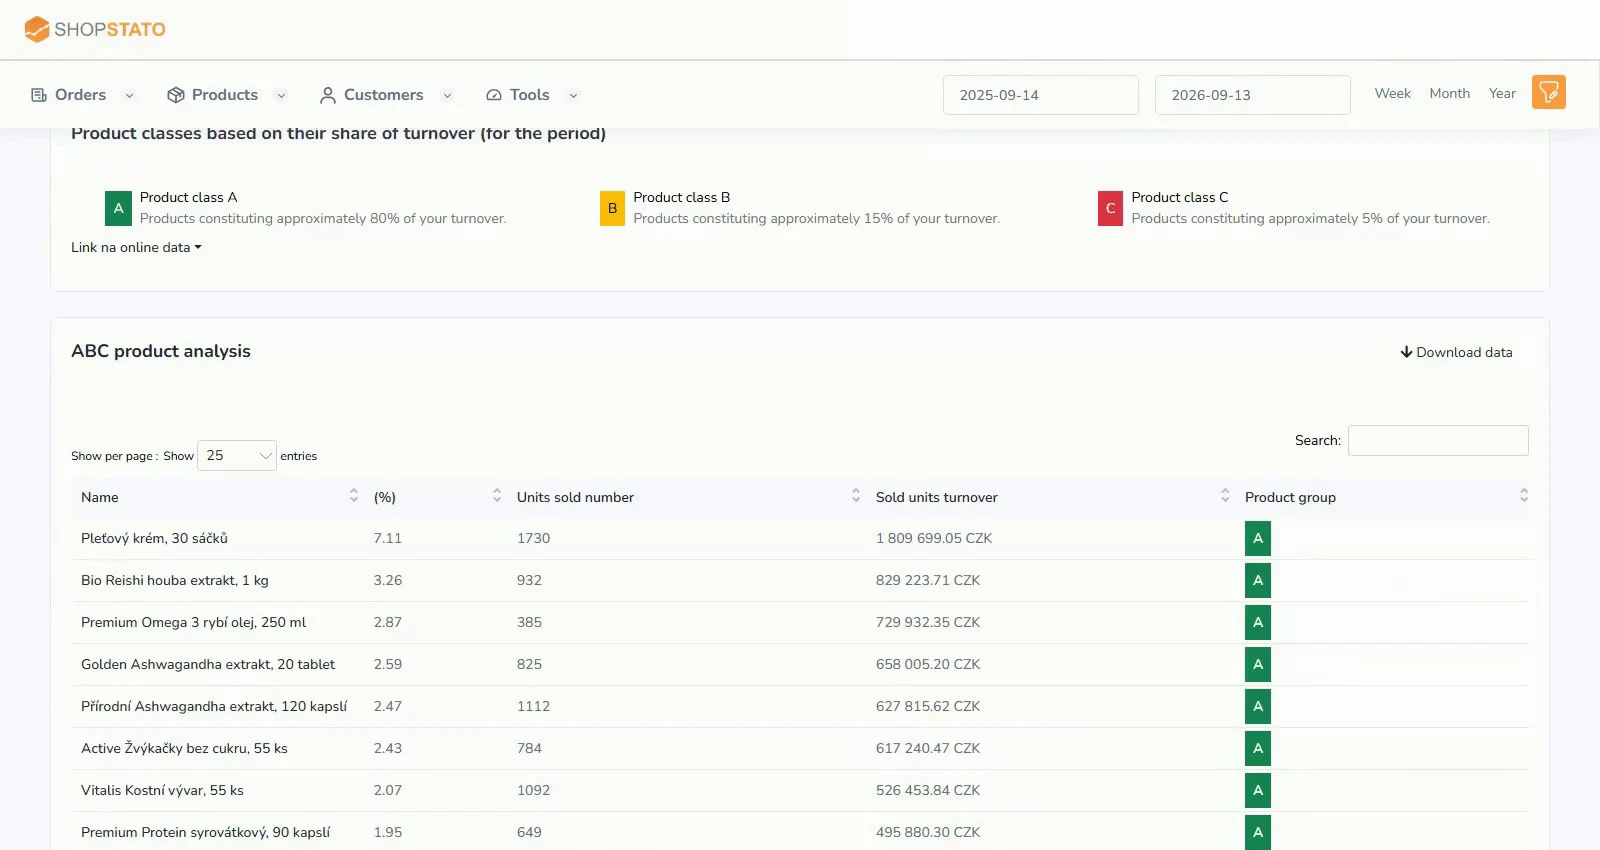 ABC product analysis: focus on the items that matter2 min read · 1 screenshot · videoProduct parameters: find the colours, sizes and variants that sell2 min read · 1 screenshot · video
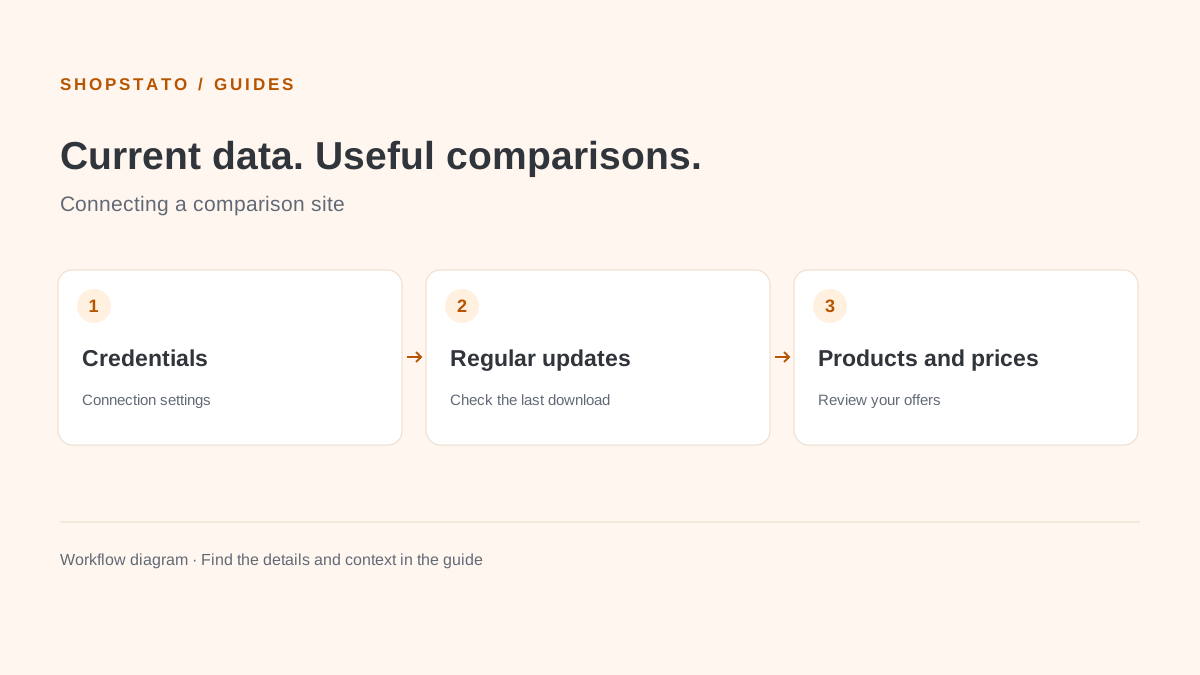 Árukereső: connect the comparison site and monitor data updates2 min readCLV: take a longer view of your customers2 min read · 1 screenshot · videoCompari: from connection settings to competitor checks2 min read
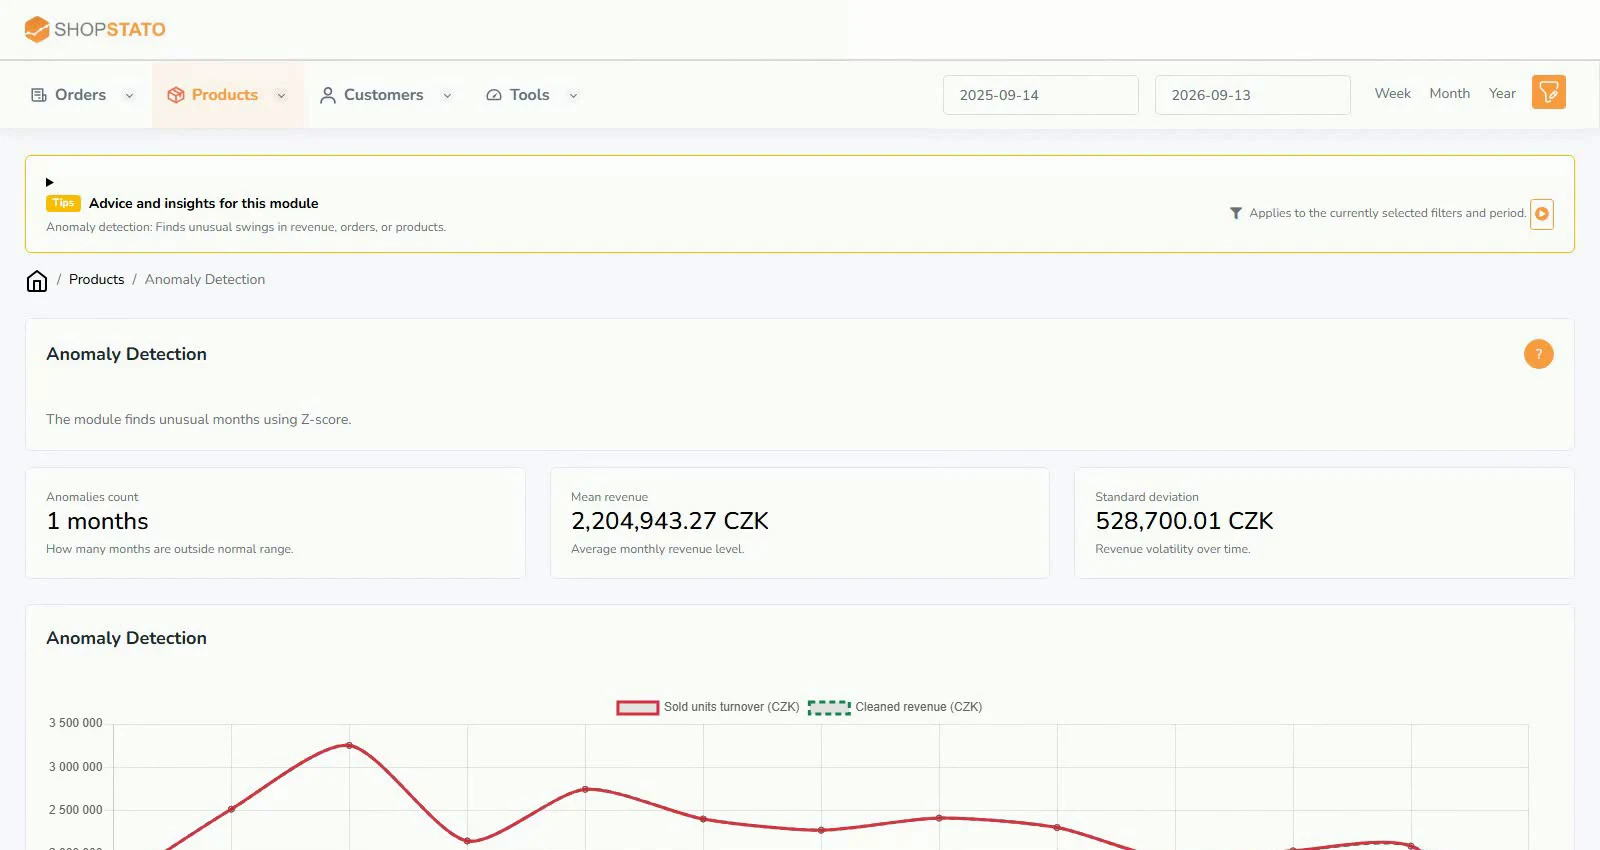 Anomaly detection: distinguish an unusual month from the normal trend2 min read · 1 screenshot · video
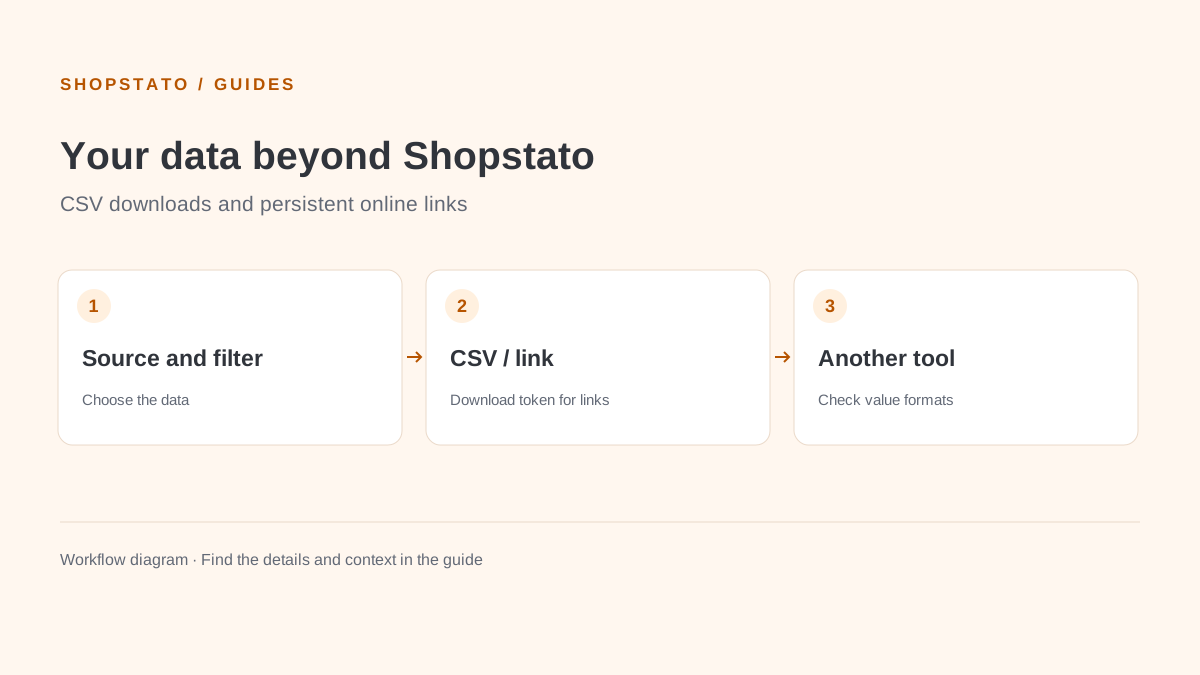 CSV exports and Download token: use your data where you need it2 min readHeureka competition: price is only the beginning2 min read · 3 screenshots · videoIdealo: connect, update and review your assortment2 min readFrequently bought together: find natural product pairs2 min read · 1 screenshot · videoPurchasing recommendations: turn sales pace into sensible replenishment2 min read · 1 screenshot · video
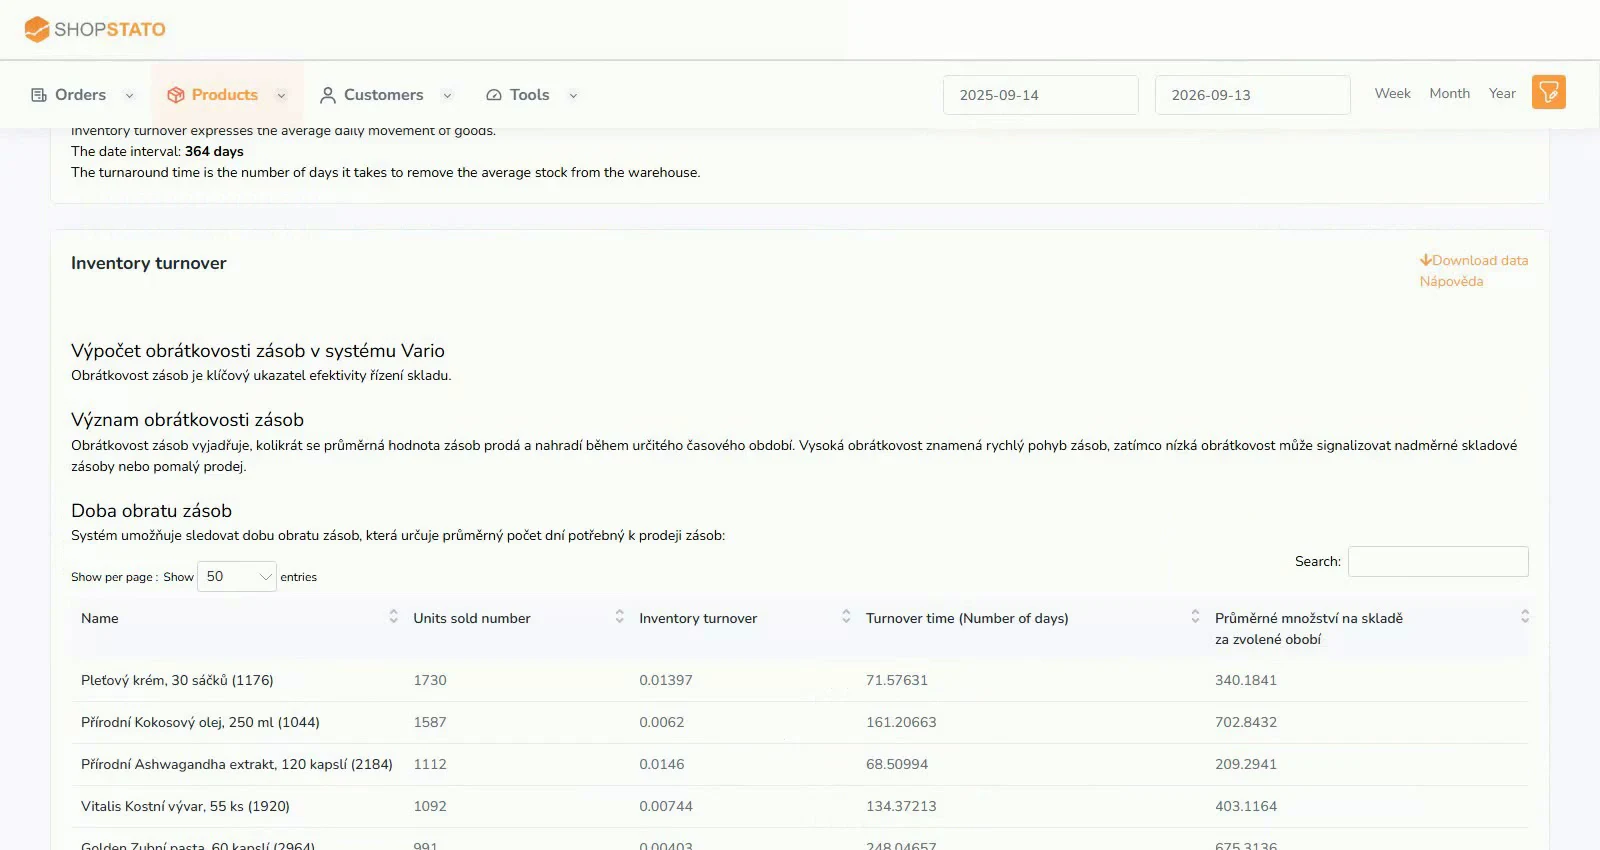 Inventory turnover: where stock turns into sales and where it waits2 min read · 1 screenshot · video
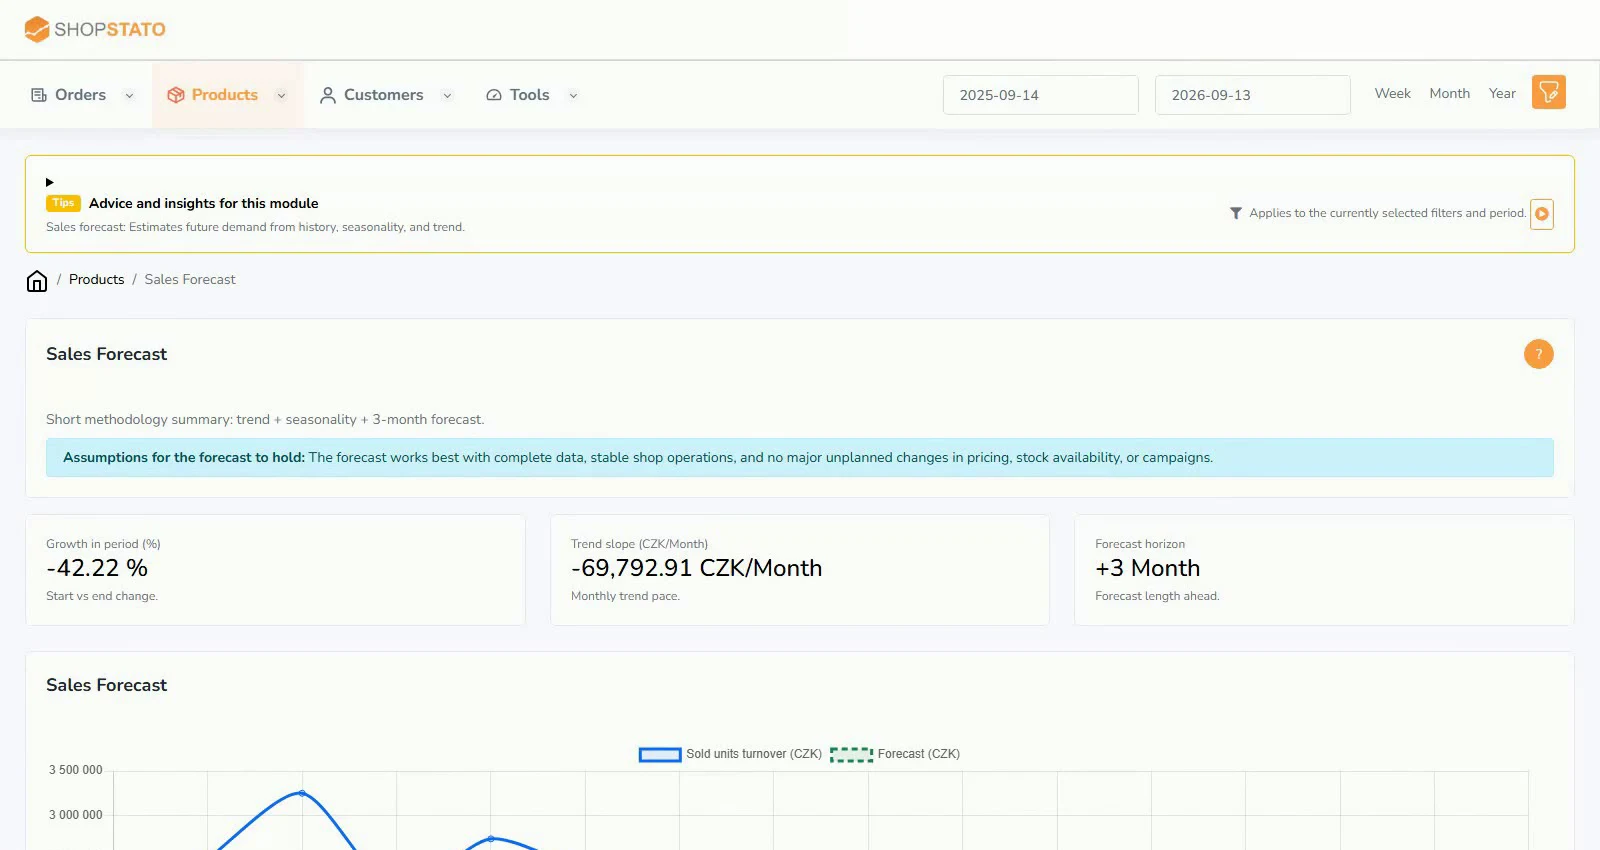 Sales forecasting: prepare for the next three months2 min read · 1 screenshot · video
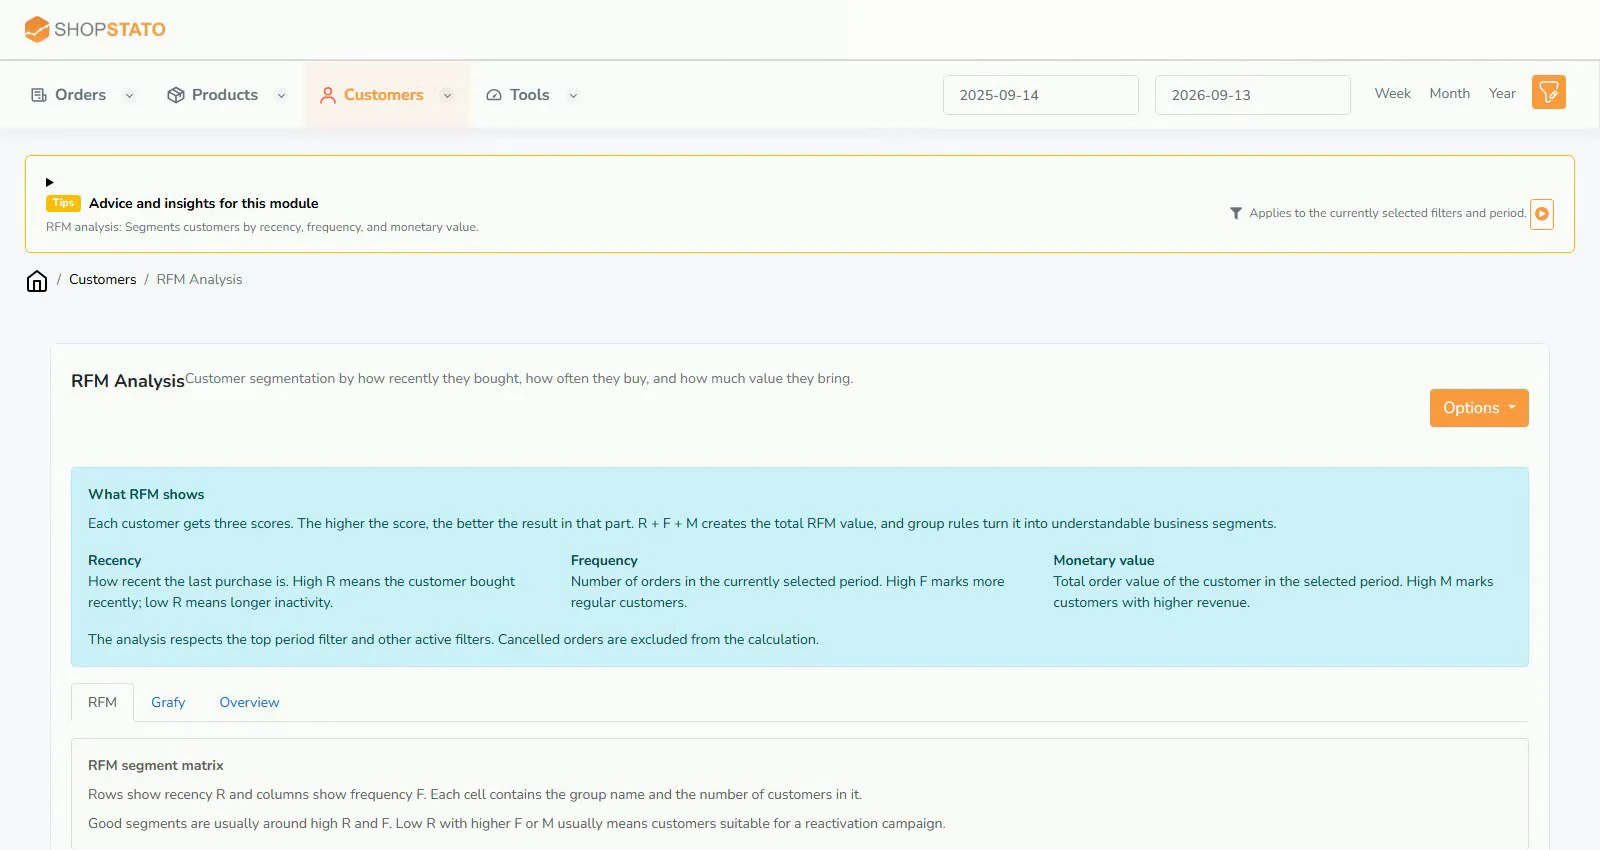 RFM analysis: turn purchase history into customer segments2 min read · 5 screenshots · video
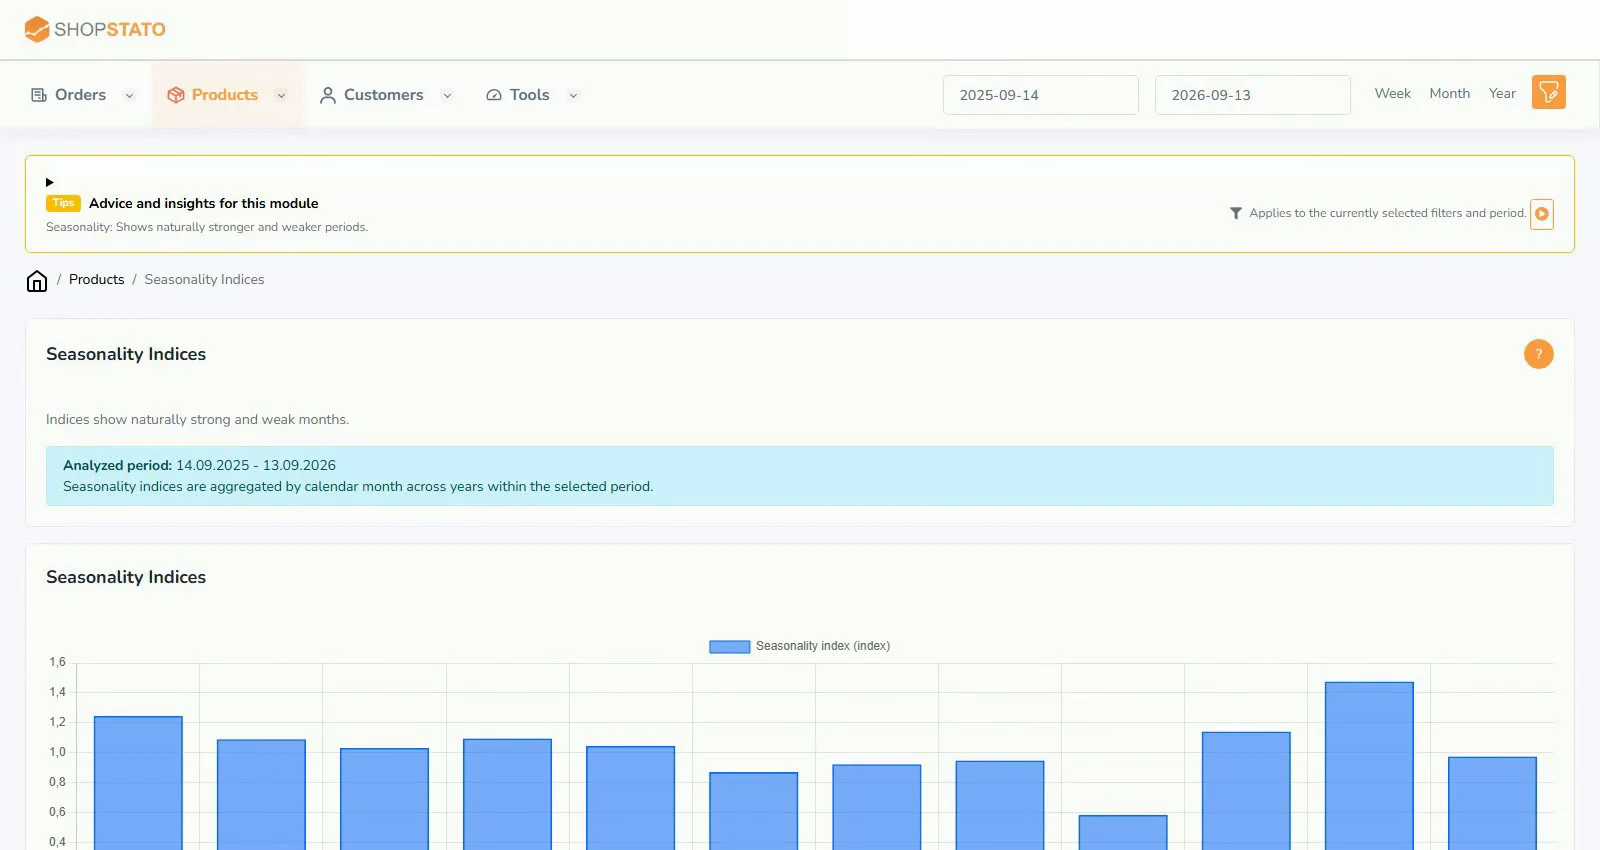 Seasonal indices: understand your store’s natural rhythm2 min read · 1 screenshot · video
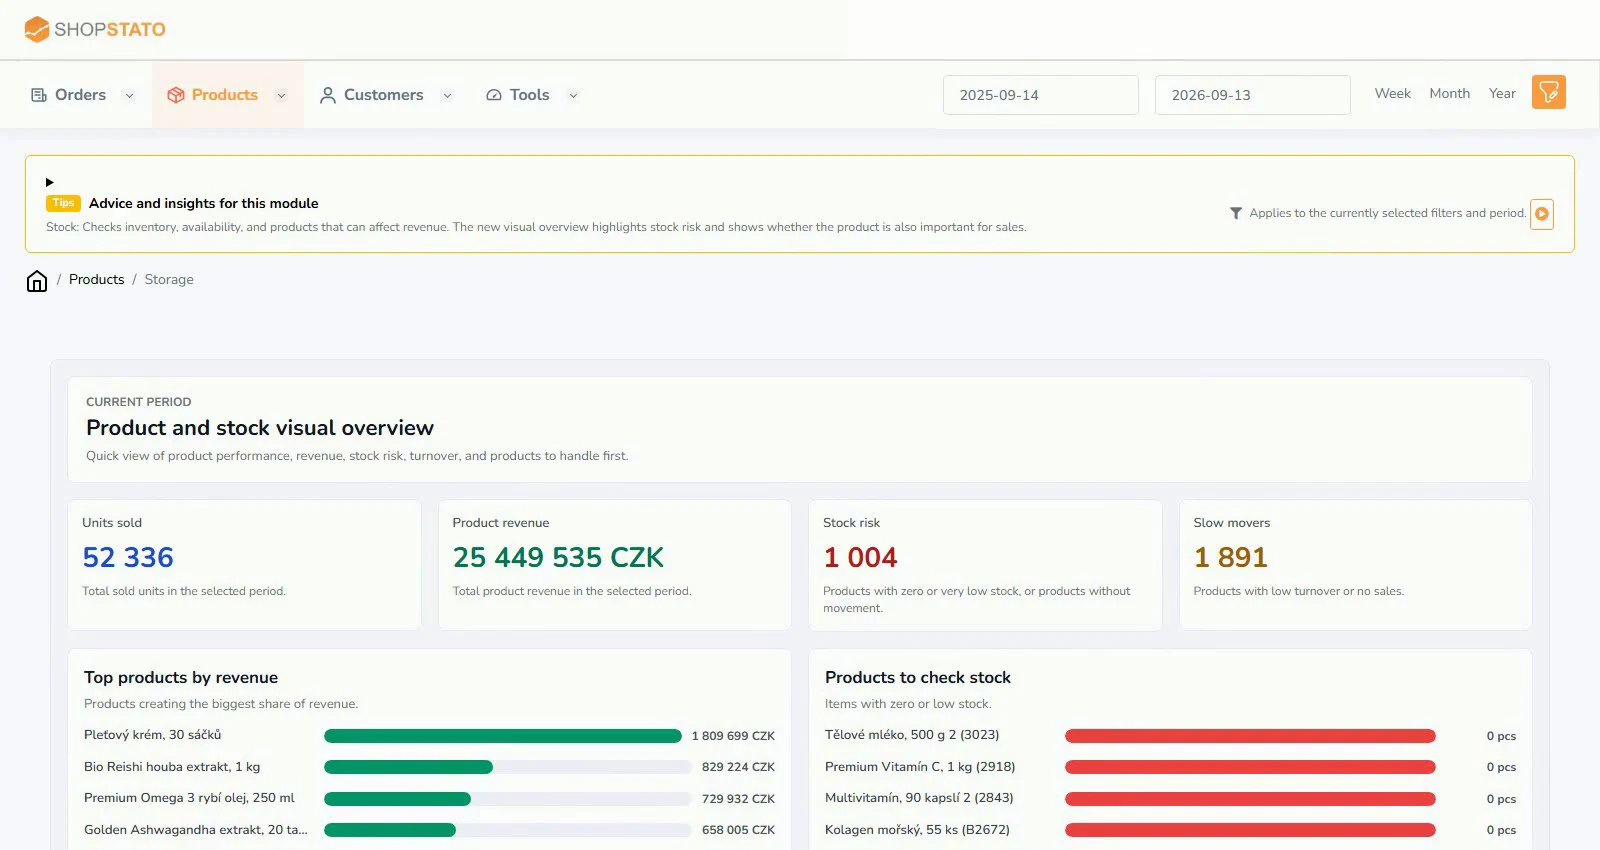 Inventory: spot shortages and excess stock in time2 min read · 1 screenshot · video
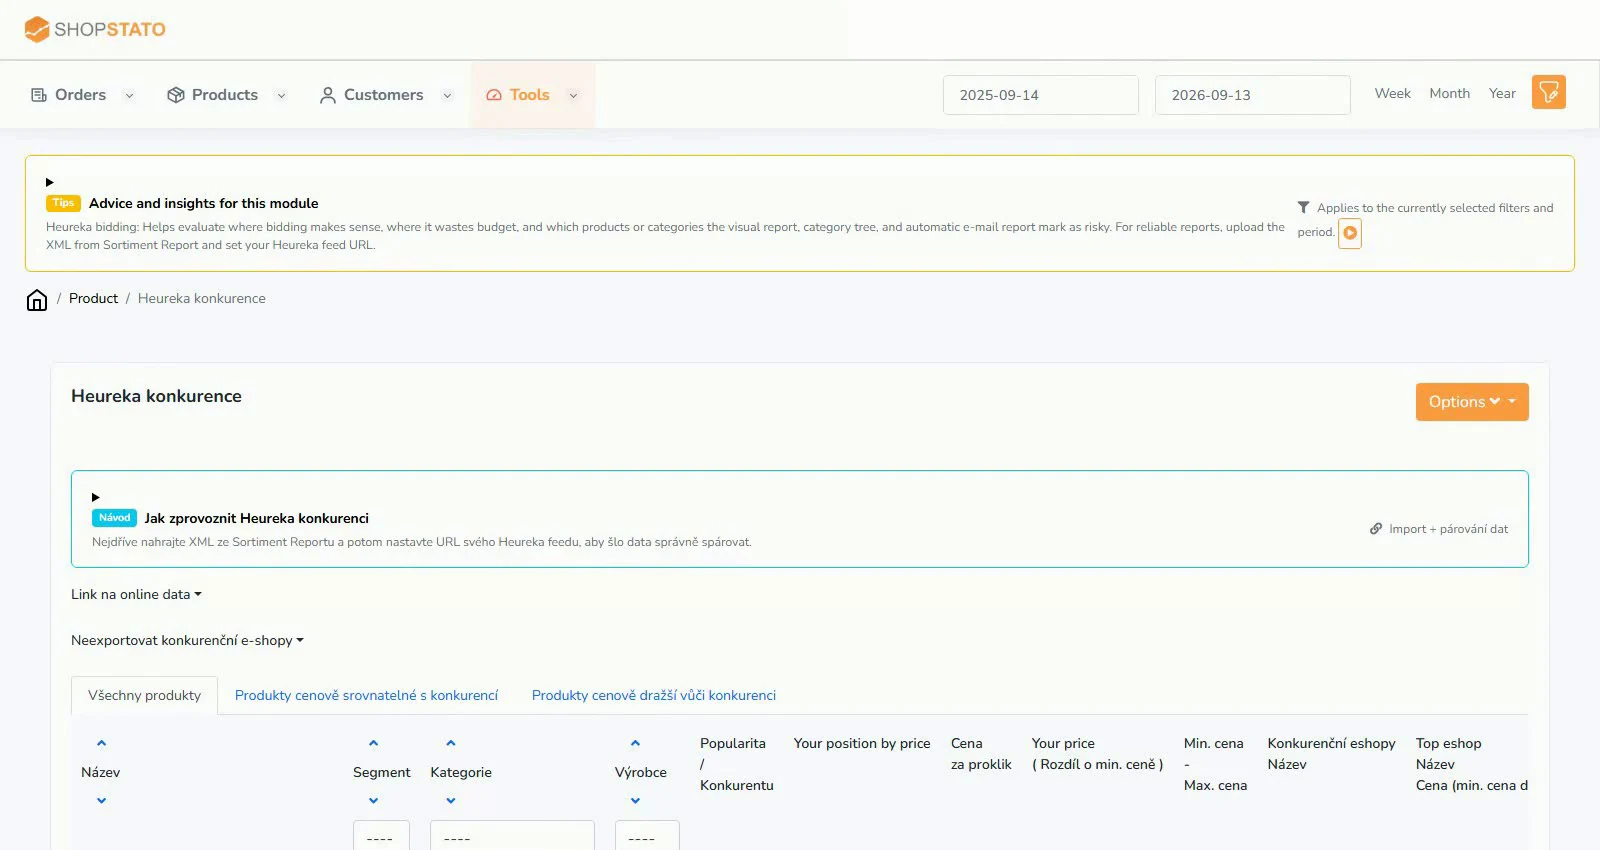 Assortment Report: turn Heureka data into concrete tasks2 min read · 2 screenshots · video
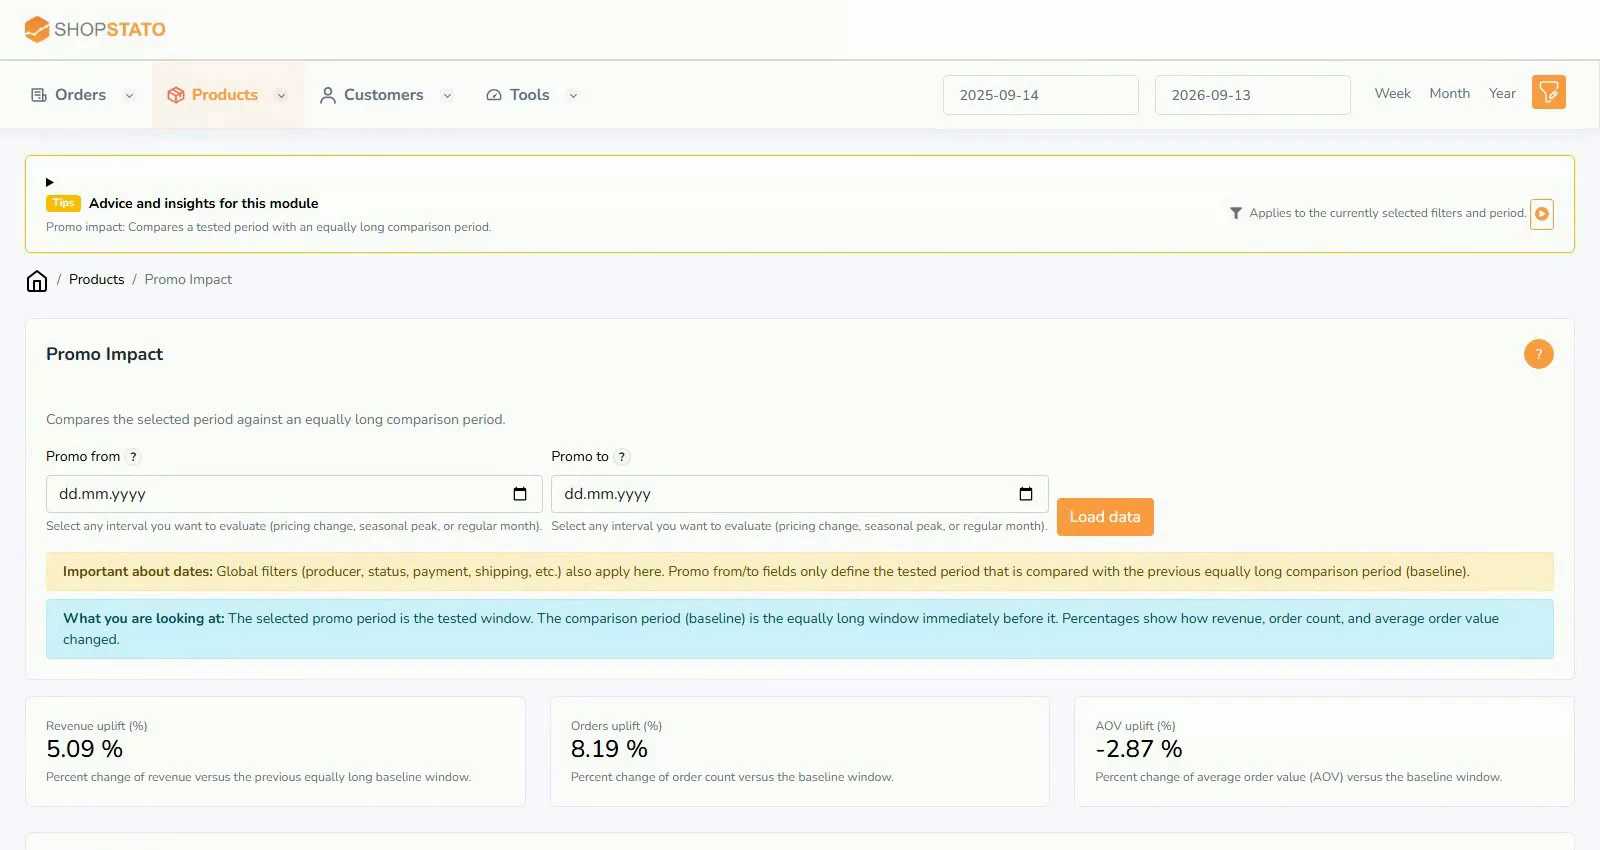 Promotion evaluation: growing revenue is only part of the result2 min read · 1 screenshot · video
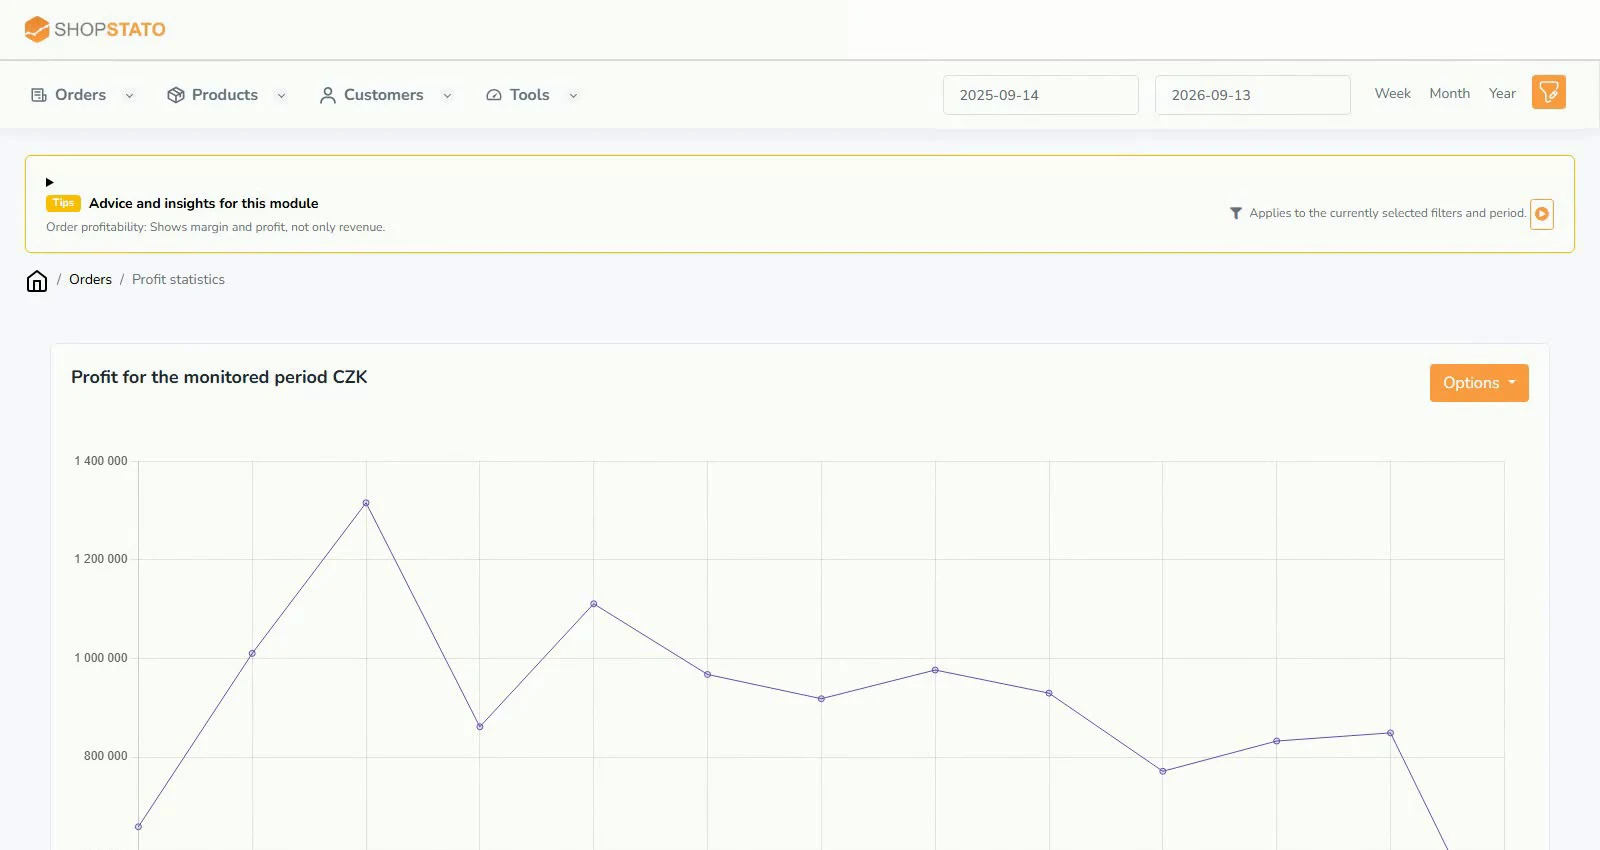 Profitability: move from high revenue to product contribution2 min read · 1 screenshot · video
Your next step
Explore your orders, products and customers in one place.