CustomersGuides
Customer groups: compare the contribution of each segment
A step-by-step guide
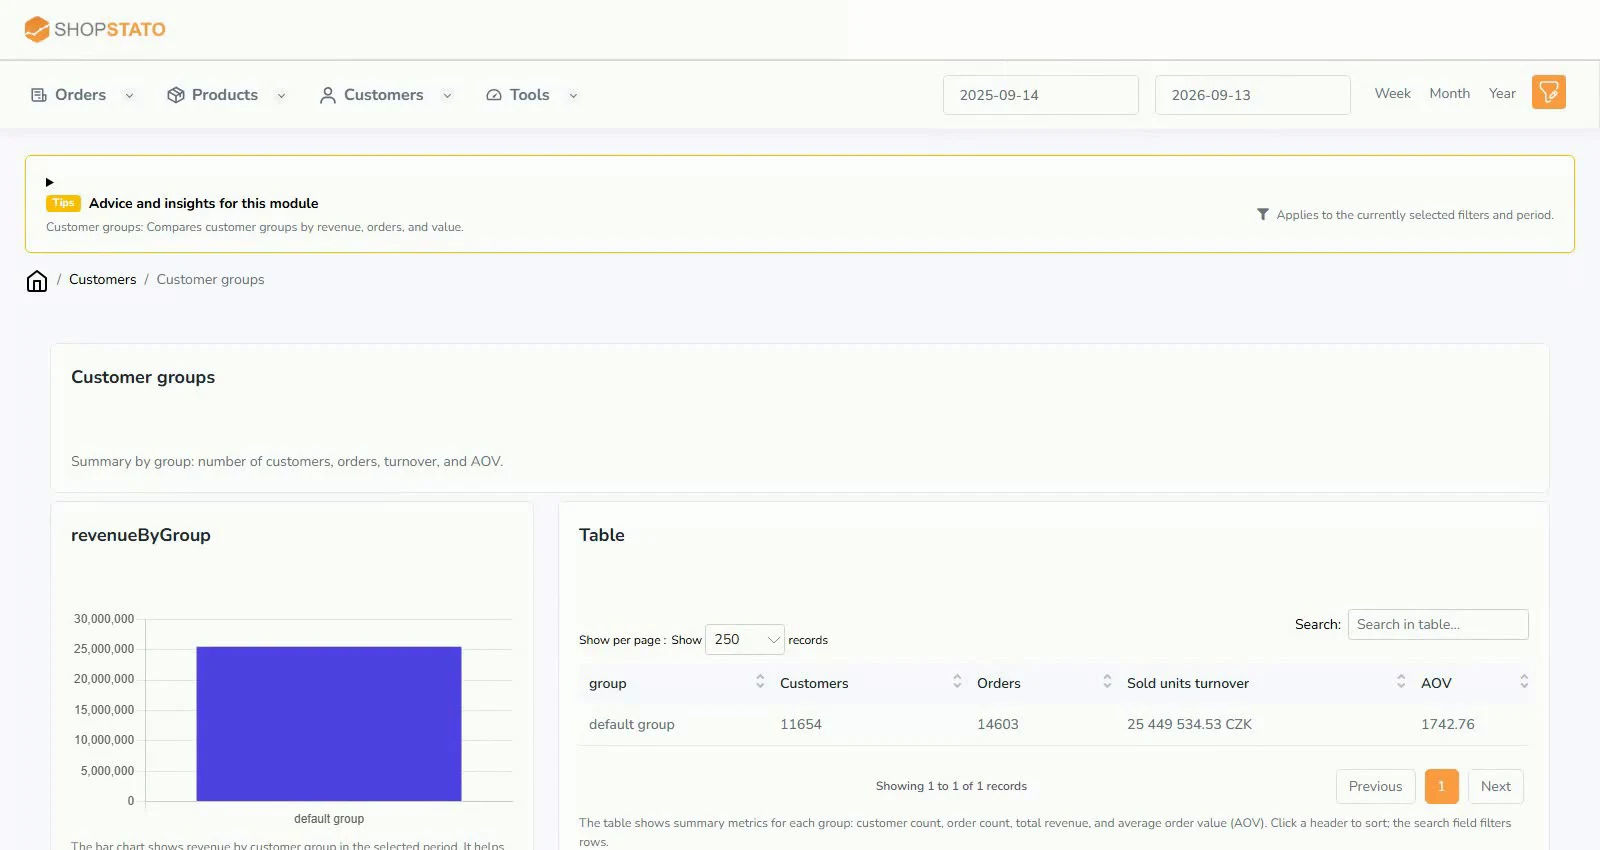
Group size alone does not show its importance. Compare customer counts, orders, revenue and average order value.
What to prepare
Consistent group assignments and the same reporting period for every comparison.
Step by step
- Choose a common reporting period.
- Compare customer counts and order counts.
- Review revenue and AOV; each answers a different question.
- Investigate group history and characteristics when differences are large.
An example from the application
 Enlarge screenshot ↗
What to consider when interpreting the result
A small group can have high AOV but low total revenue. Consider both before redirecting marketing attention.
Continue in the application
Application links require sign-in. Access to a report depends on your permissions and the relevant module.
Source: Shopstato help centre . This English guide adds practical context and examples from English video tutorials.