Store growthModules
Seasonal indices: understand your store’s natural rhythm
A step-by-step guide
Stronger and weaker months do not necessarily reflect a change in store quality. Seasonal indices show monthly deviations from long-term average revenue.
What to prepare
Continuous monthly history covering comparable periods.
Step by step
- Check that monthly history is continuous.
- Read 1.00 as the long-term average.
- Values above 1.00 indicate above-average months; values below it indicate below-average months.
- Use stronger and weaker periods when planning stock, capacity and other activities.
An example from the application
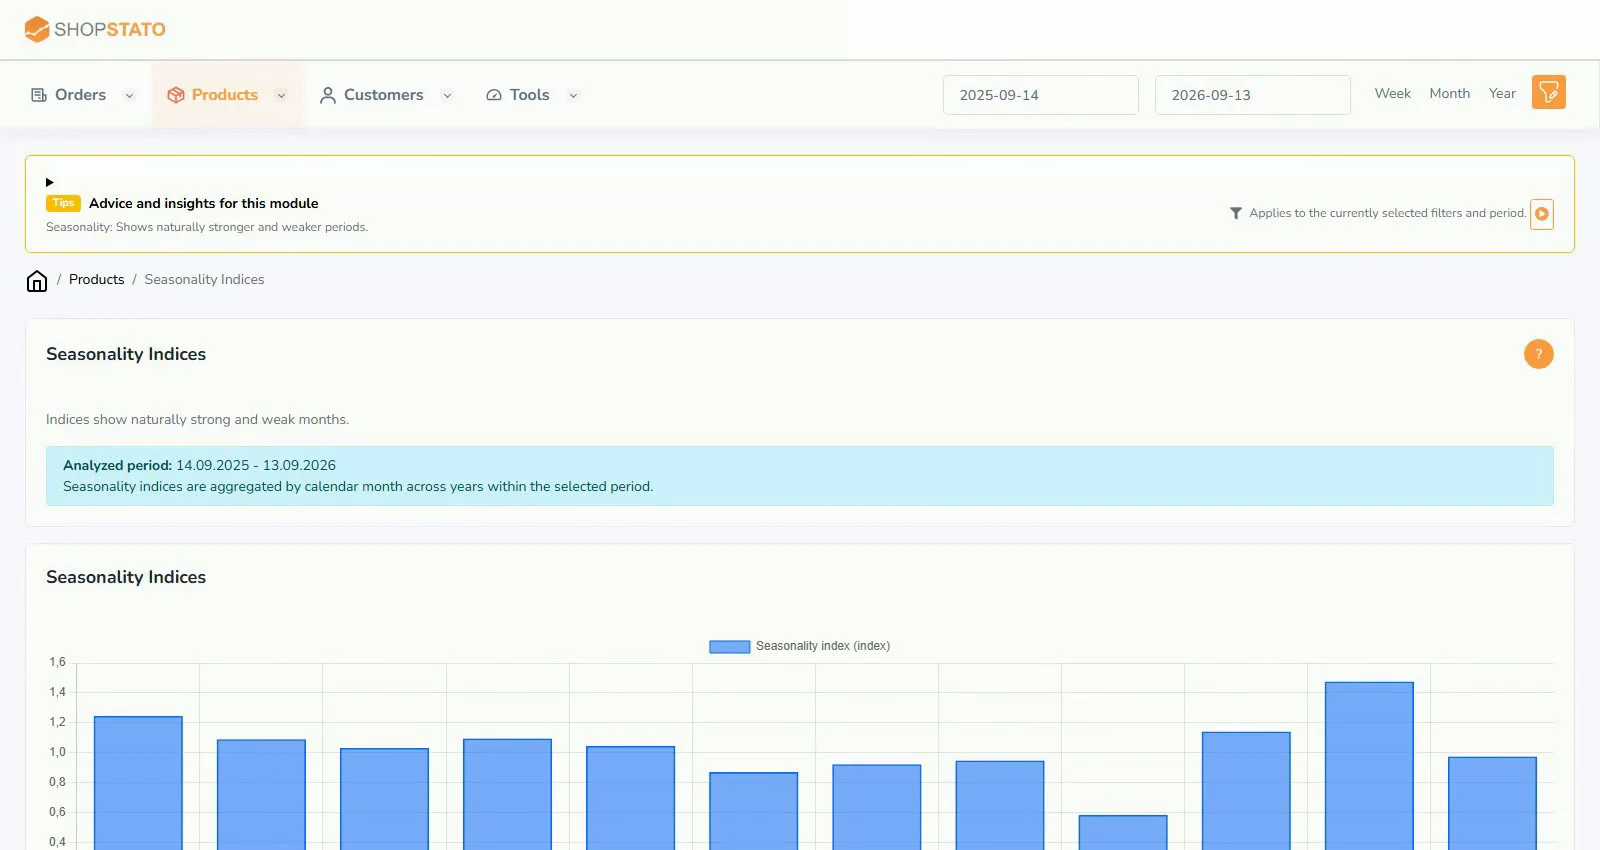 Enlarge screenshot ↗
What to consider when interpreting the result
A single promotion can dominate short or incomplete history. Verify seasonal patterns over longer periods and alongside anomalies.
Continue in the application
Application links require sign-in. Access to a report depends on your permissions and the relevant module.
Source: Shopstato help centre . This English guide adds practical context and examples from English video tutorials.