OrdersGuides
Basket size: how many items customers actually buy
A step-by-step guide
Order value and item count answer different questions. The basket report shows the average, median and distribution of items per order.
What to prepare
The same period and order selection used in related sales reports.
Step by step
- Set a consistent period and order selection.
- Compare the average and median item count.
- Review the distribution of small and large baskets.
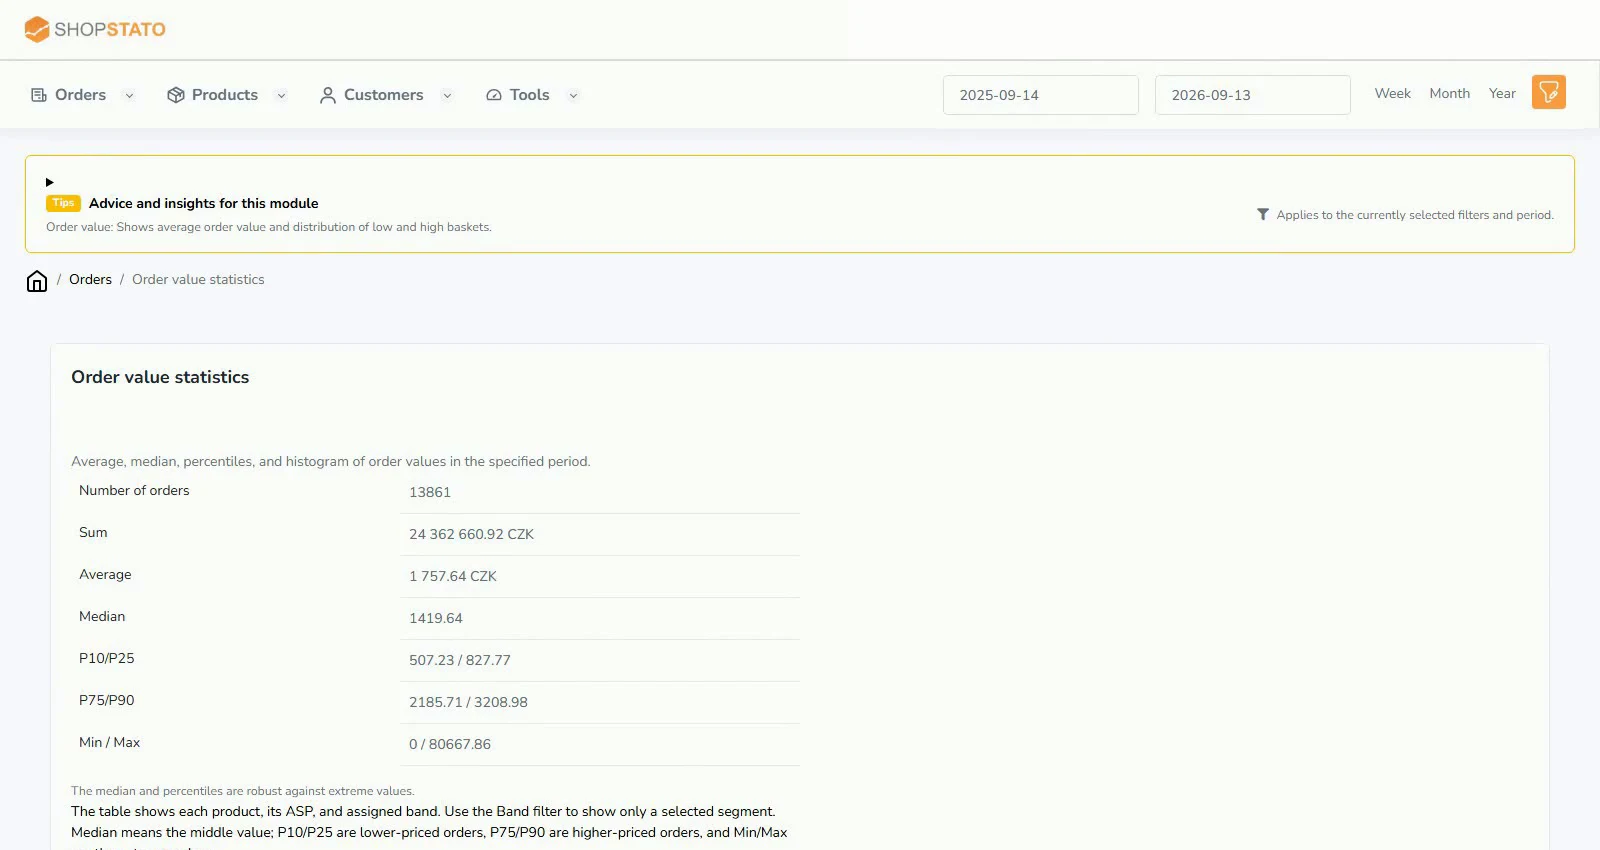
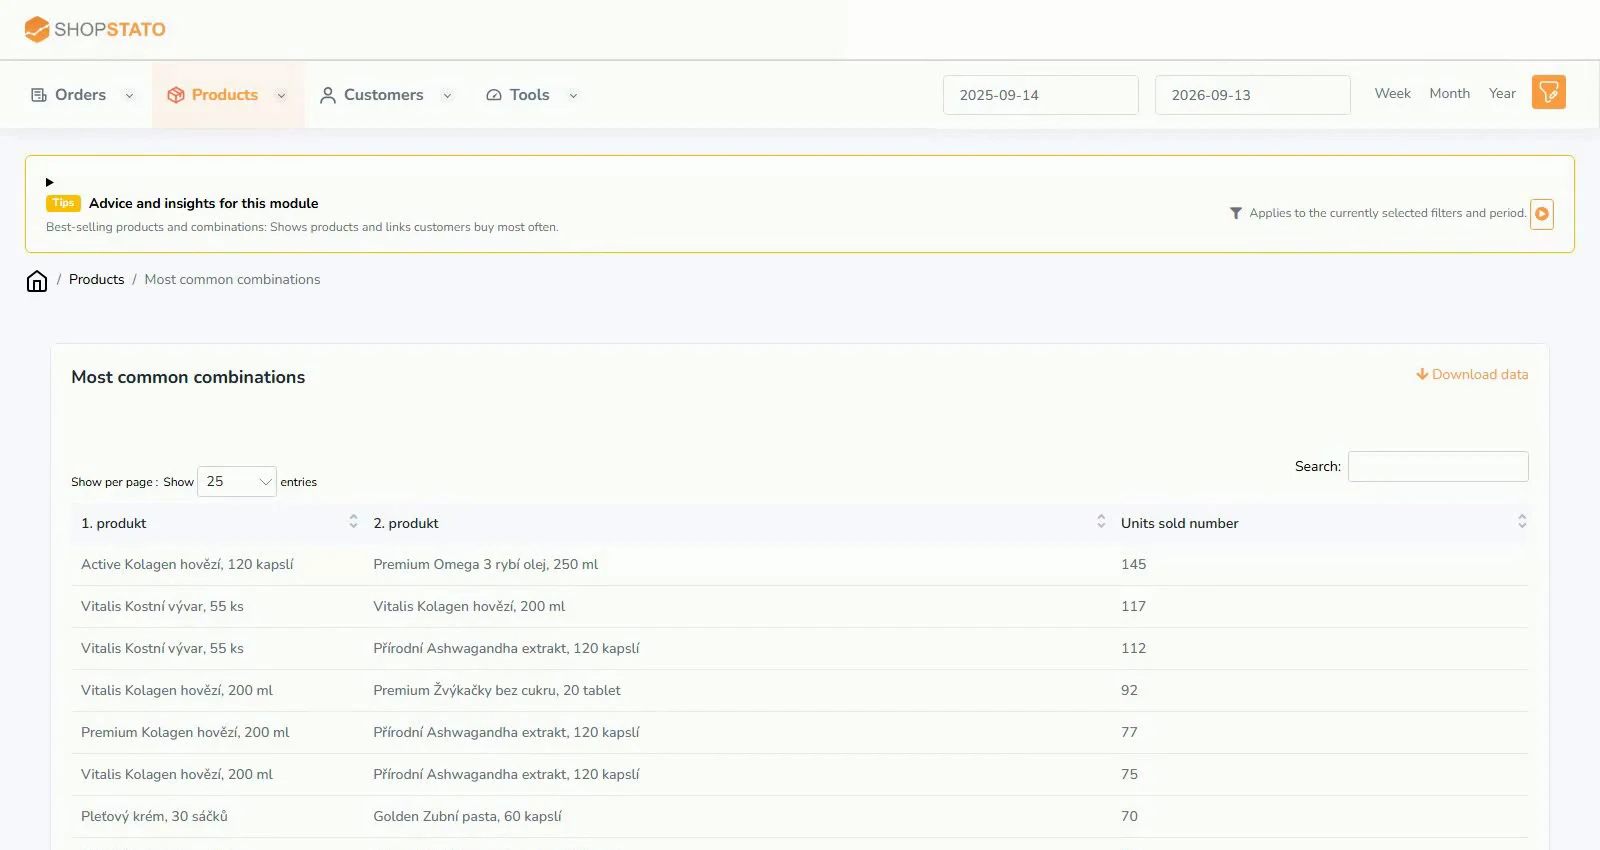
- Read the result alongside order value and frequently bought combinations.
An example from the application
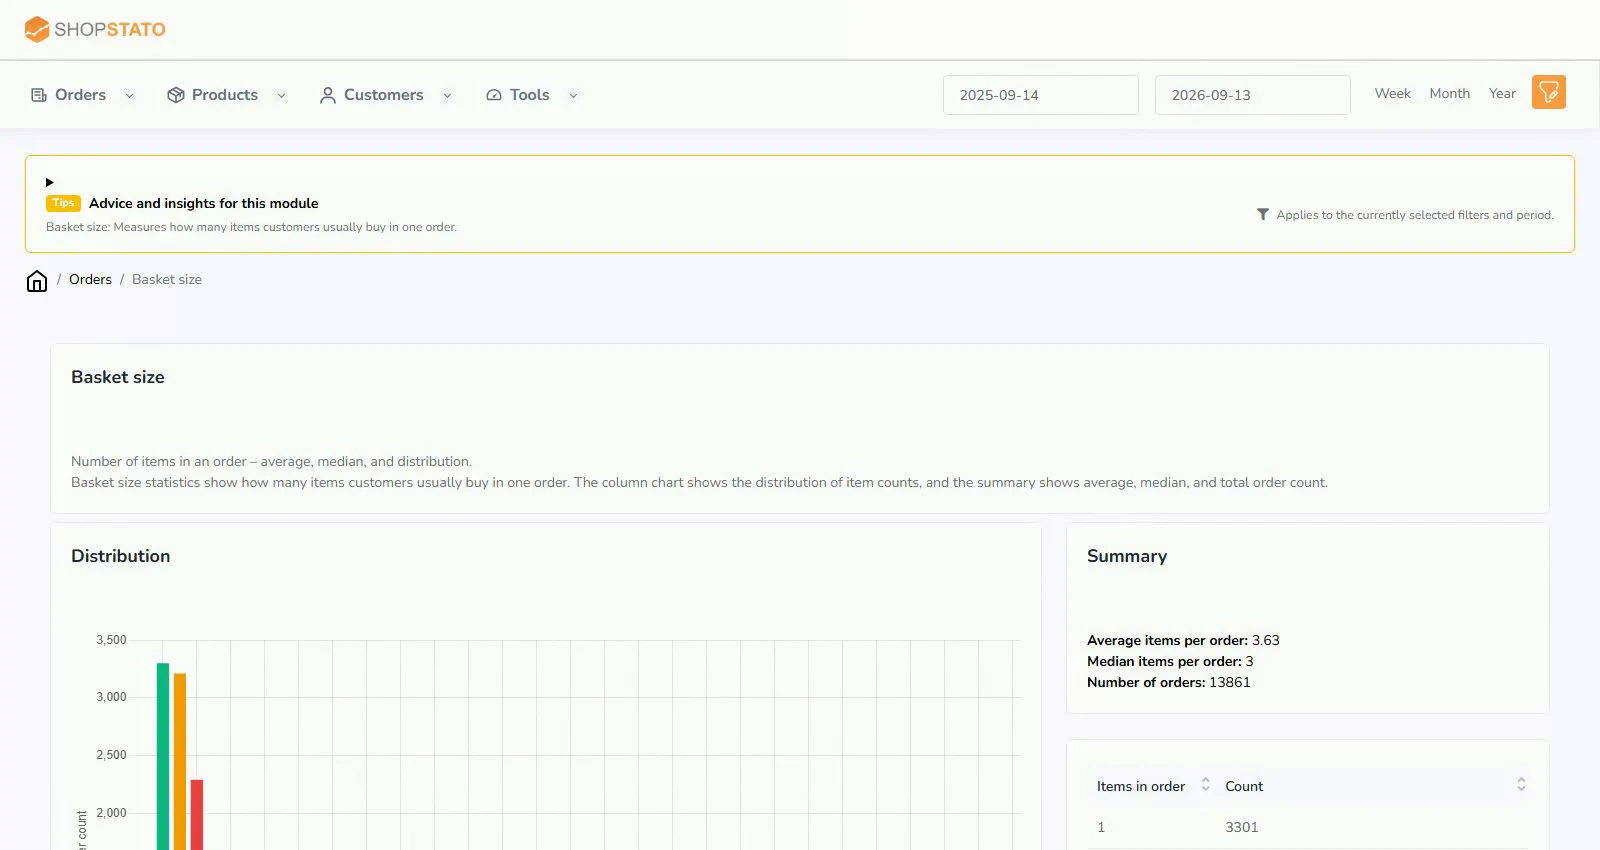 Enlarge screenshot ↗
What to consider when interpreting the result
More items do not automatically mean greater value. A cheap accessory, a gift or a change in the product mix can affect the result.
Continue in the application
Application links require sign-in. Access to a report depends on your permissions and the relevant module.
Source: Shopstato help centre . This English guide adds practical context and examples from English video tutorials.