OrdersGuides
Order value: look beyond the average
A step-by-step guide
A few large purchases can shift average order value. The median, percentiles and histogram help show what a typical purchase looks like.
What to prepare
Orders for a consistent period and a clearly defined selection of order statuses.
Step by step
- Choose the period and order statuses.
- Compare the average with the median; a large difference can indicate unusually large or small orders.
- Use the histogram to see the most common order value bands.
- Compare equivalent periods with identical filters, for example before and after a promotion.
An example from the application
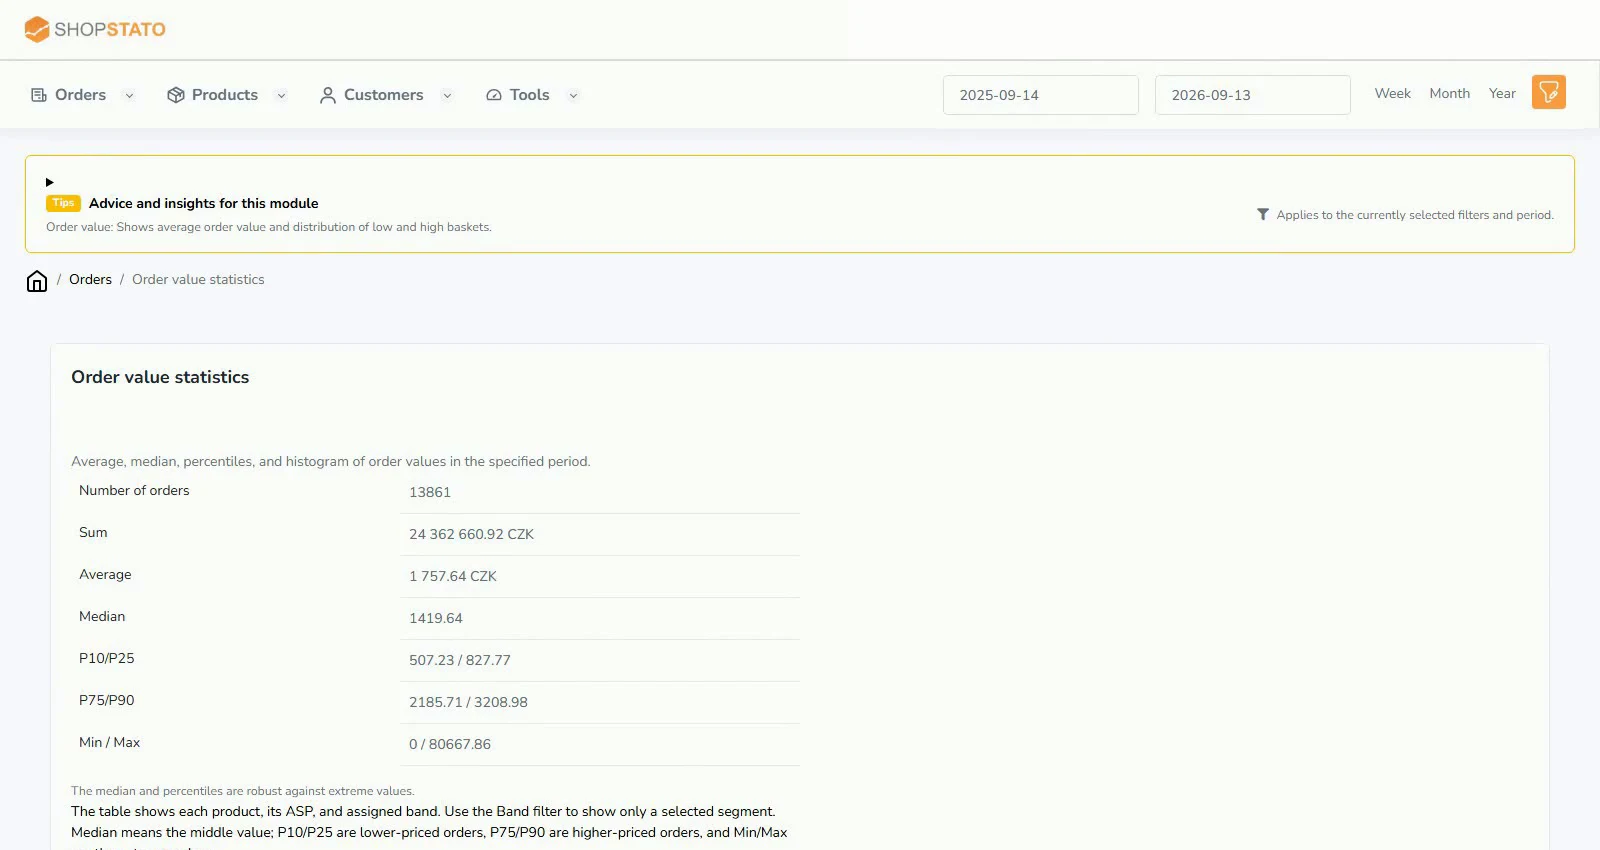 Enlarge screenshot ↗
What to consider when interpreting the result
Read AOV alongside order count and revenue. A higher average with far fewer orders may not improve the overall result.
Continue in the application
Application links require sign-in. Access to a report depends on your permissions and the relevant module.
Source: Shopstato help centre . This English guide adds practical context and examples from English video tutorials.