Shopstato features
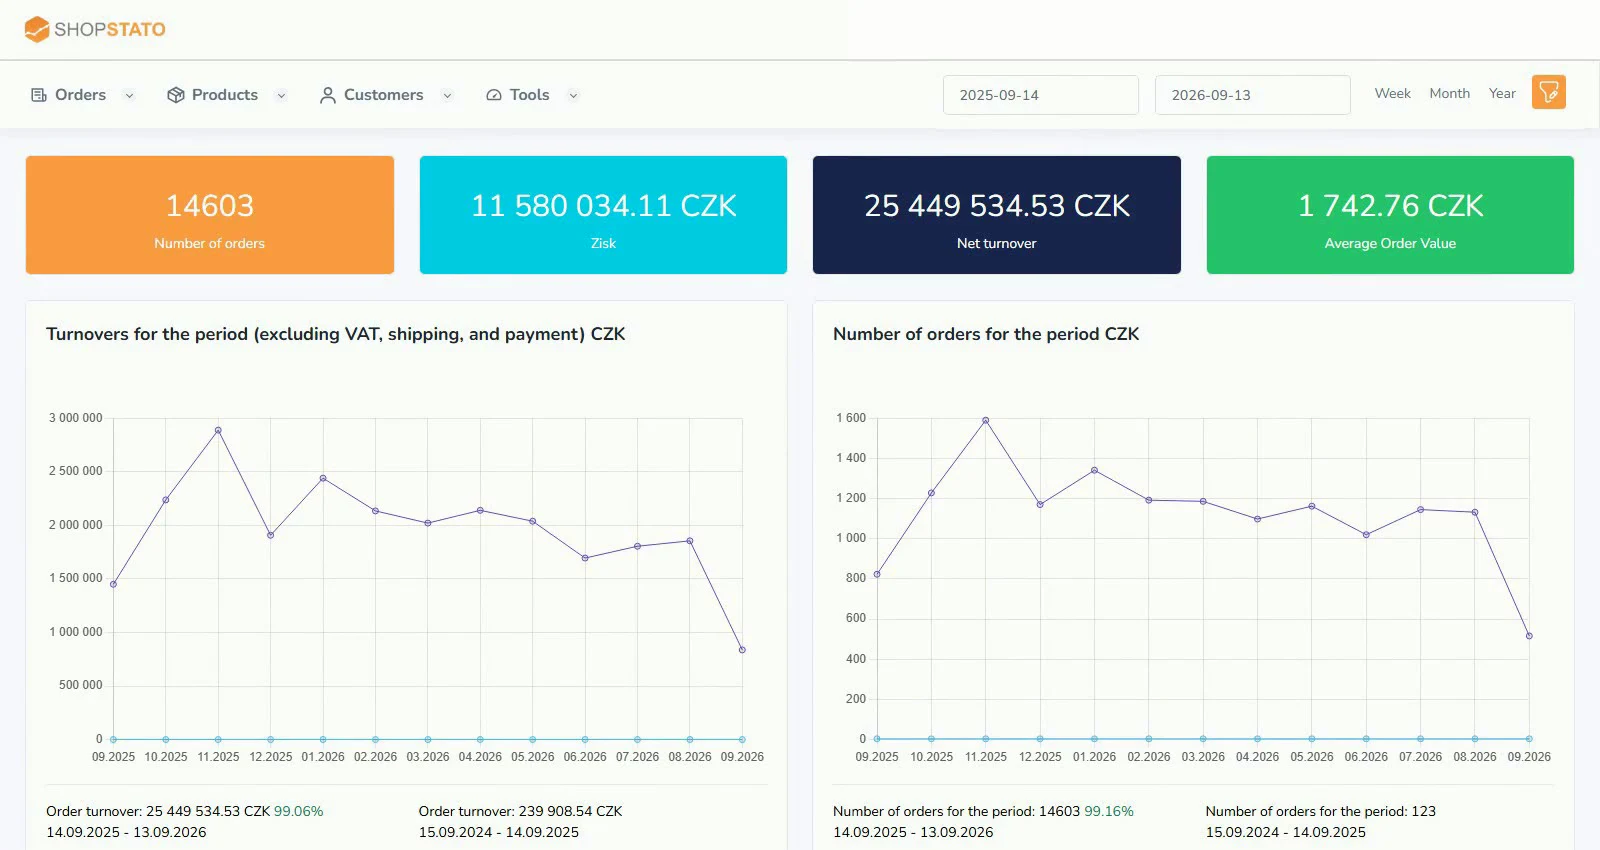
Shopstato turns completed store orders into understandable charts and tables. Review trends, investigate changes and use your own data to plan the next step.
Order analysis
Follow revenue, order counts, order statuses and changes compared with earlier periods. Review the days and hours when people buy, the share of repeat purchases and the shipping and payment methods they choose.
Products and manufacturers
Find bestsellers, compare manufacturers and identify products with little movement. Purchase prices make it possible to add product and order profitability; current inventory adds stock availability and turnover context.
Customer statistics
Understand who returns, how often people buy and how customer value changes. Use lifetime statistics, cohorts, RFM and churn risk to decide which groups need a different kind of care.
What can you review?
| Area | Examples in Shopstato |
|---|---|
| Orders | Revenue, order count, trends, statuses, timing, AOV and basket size |
| Products | Sales, profitability, ABC groups, manufacturers, combinations and parameters |
| Customers | Repeat purchases, lifetime statistics, CLV, RFM, cohorts and churn risk |
| Inventory | Stock levels, slow movers, turnover and purchasing recommendations |
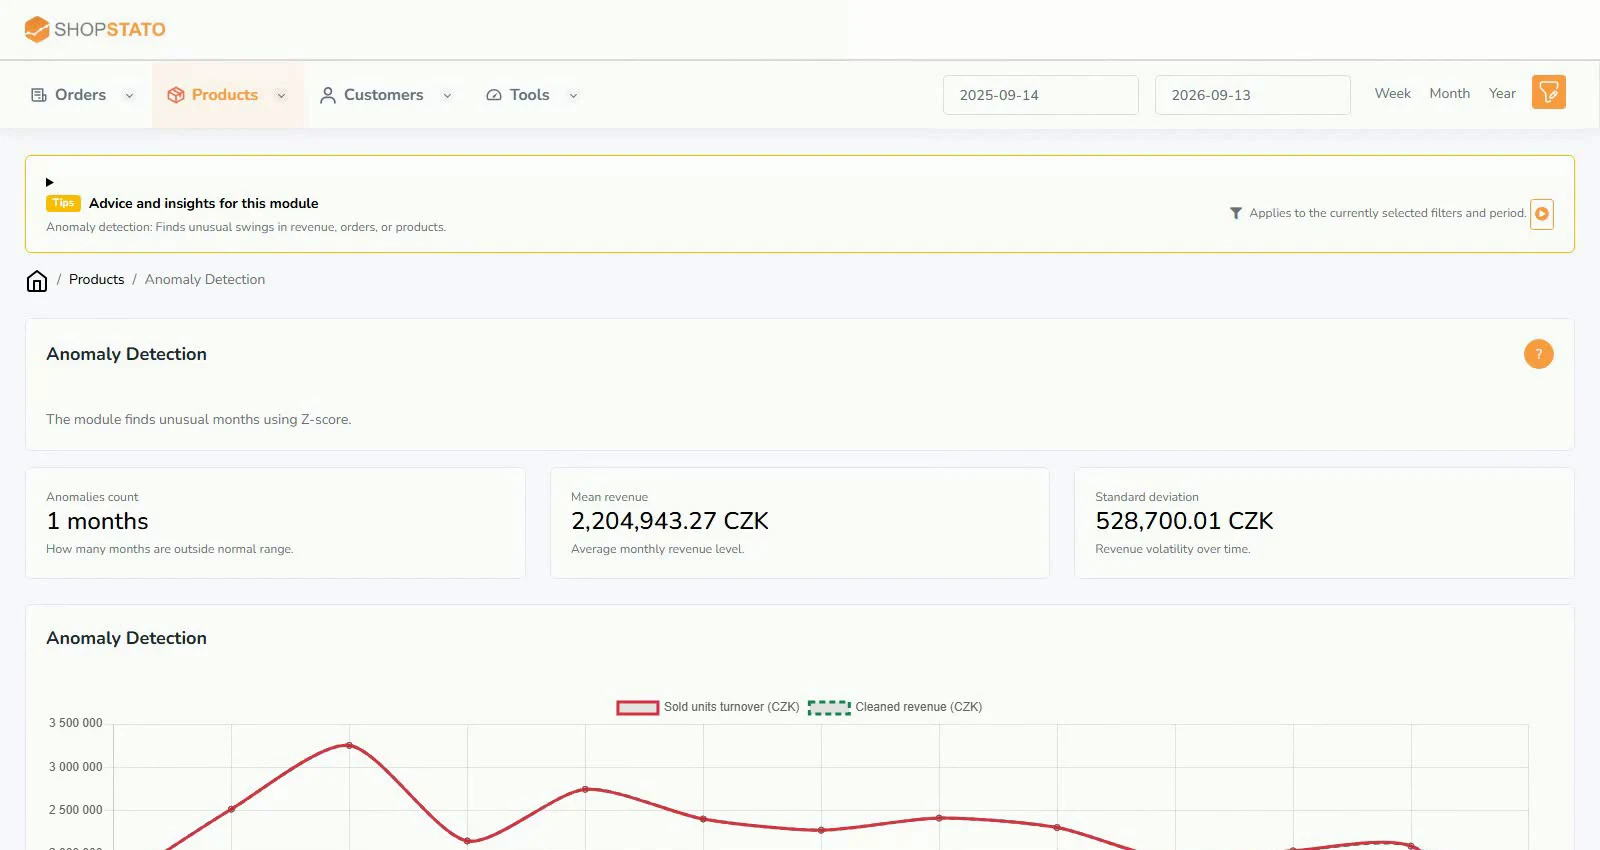
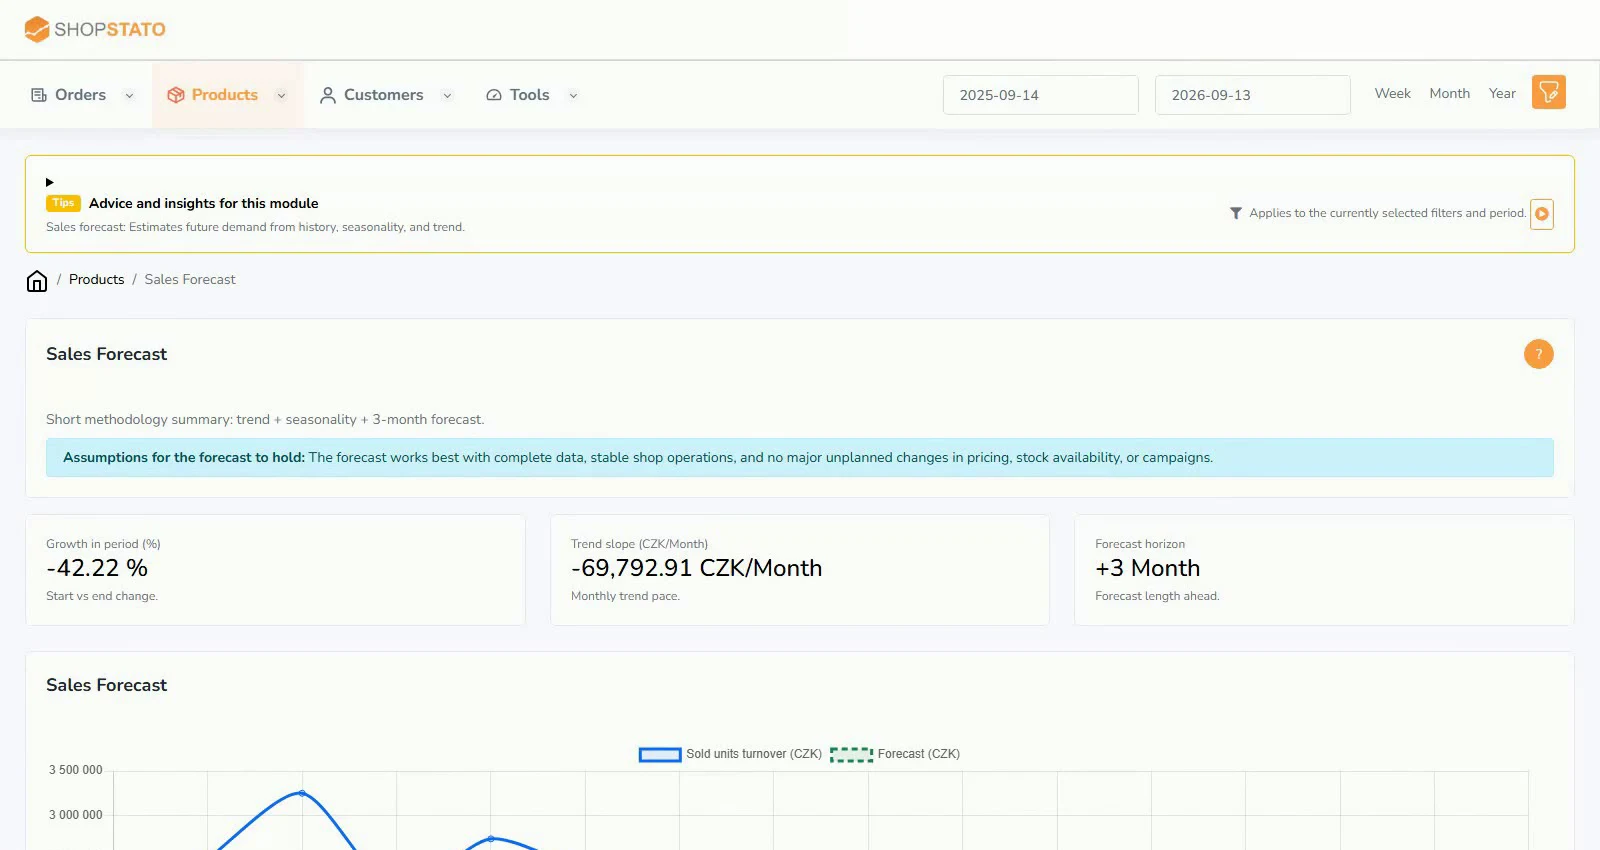
| Planning | Sales forecasts, seasonal indices, anomalies and promotion evaluation |
| Competition | Assortment reports, price comparisons, categories and email alerts |
| Data access | CSV exports, persistent links and API integrations |
Available reports depend on your data, permissions and active modules. Start with the practical guides to learn what each report needs and how to read it.