Store growthModules
Anomaly detection: distinguish an unusual month from the normal trend
A step-by-step guide
One exceptional month can distort a trend. Z-score anomaly detection highlights unusual revenue and provides an adjusted value for more robust reporting.
What to prepare
Continuous, complete monthly revenue history and consistent order selection.
Step by step
- Check monthly history for gaps.
- Review flagged months; the help specifies an absolute Z-score threshold of at least 2.
- Compare original and adjusted values.
- Check whether each deviation reflects a campaign, operational change or data error.
An example from the application
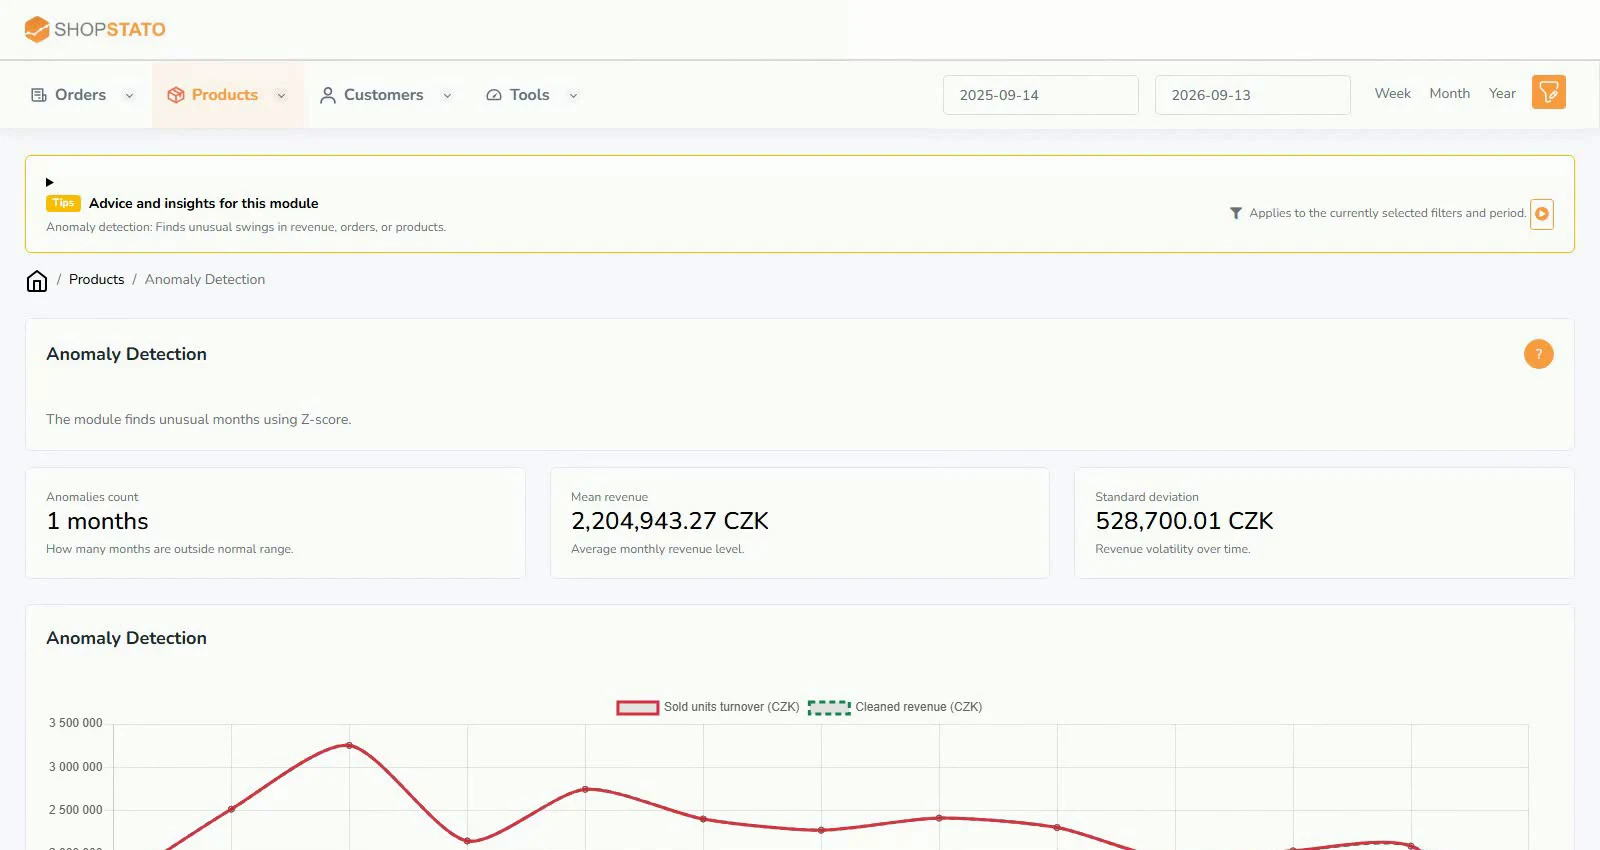 Enlarge screenshot ↗
What to consider when interpreting the result
A statistically unusual month is not necessarily incorrect. A major campaign or service interruption can be a real part of your store history.
Continue in the application
Application links require sign-in. Access to a report depends on your permissions and the relevant module.
Source: Shopstato help centre . This English guide adds practical context and examples from English video tutorials.