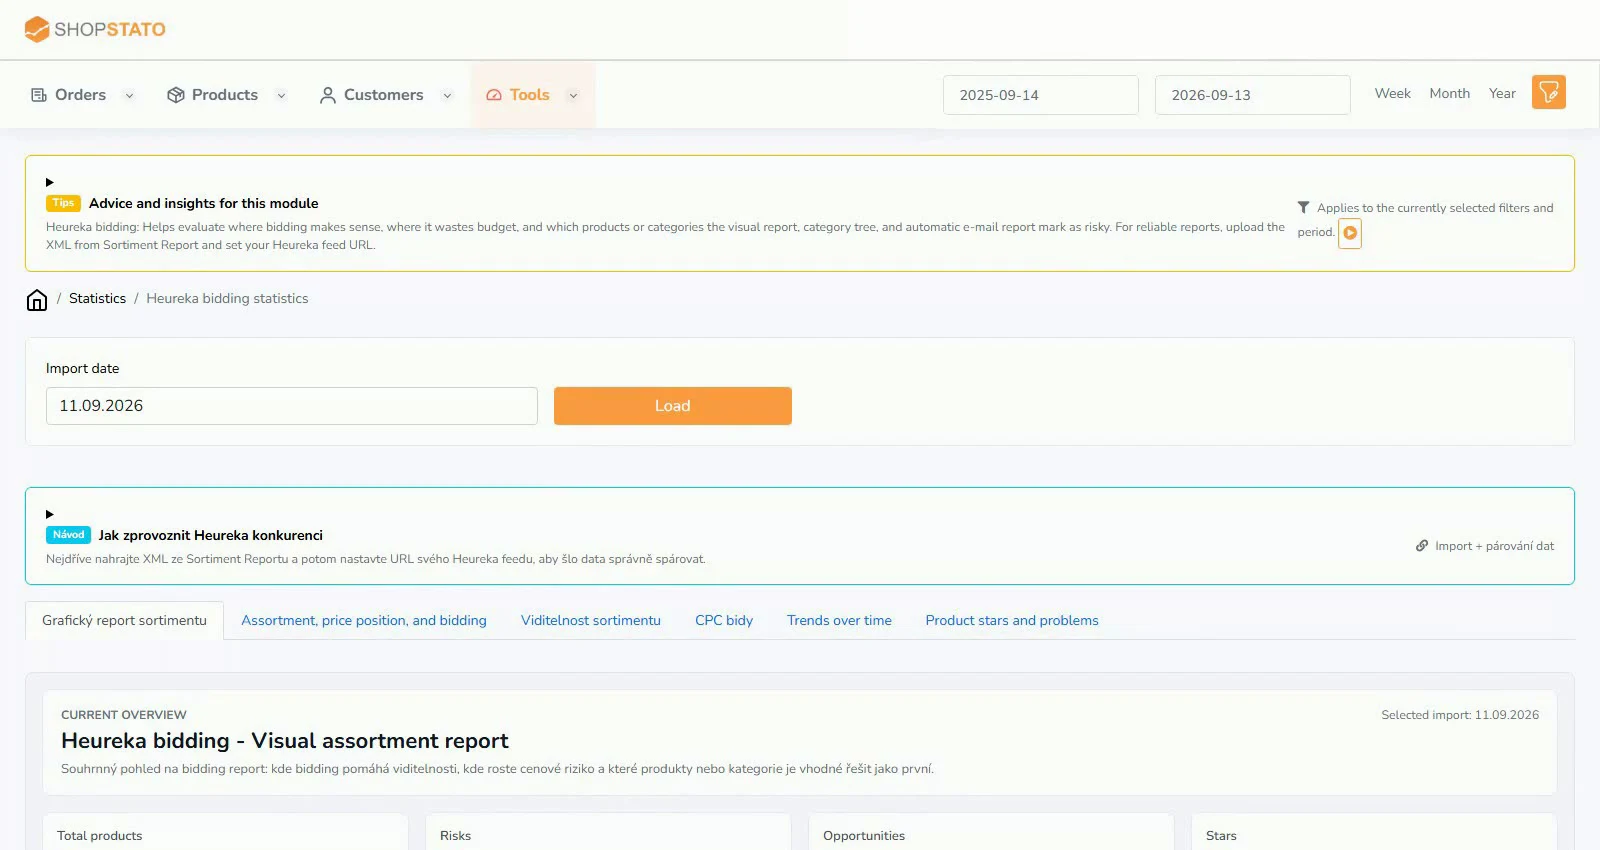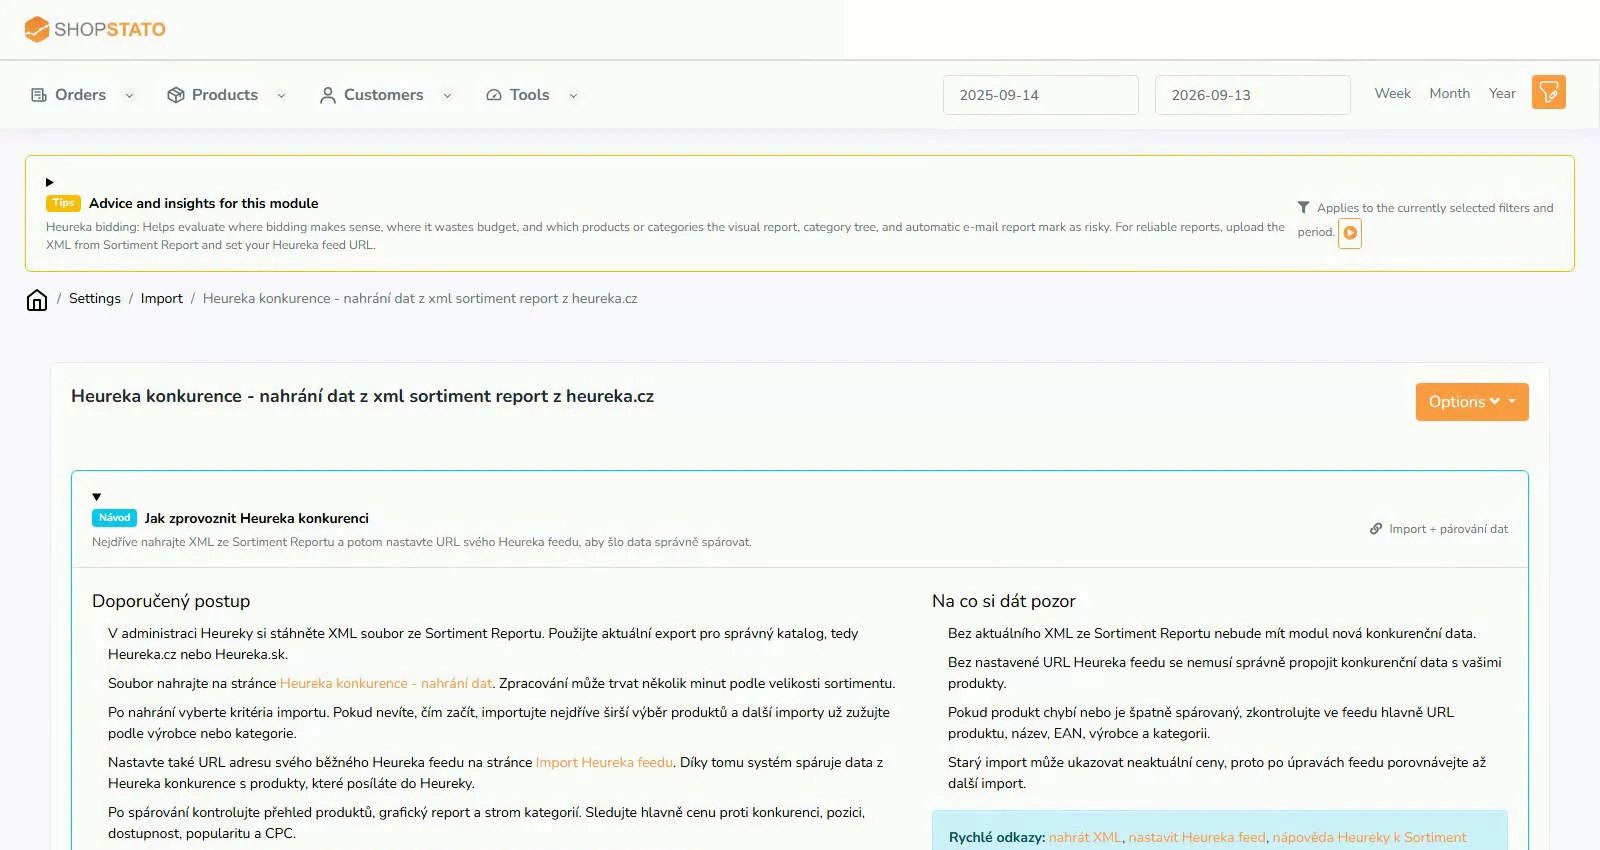
Heureka competition: prepare data for price comparisons
Use a current Assortment Report XML and, ideally, your regular Heureka feed URL. One describes the market; the other helps identify your own products.
GuidesRead article
Ideas for your online store
Practical guides and context to help turn data into better decisions.
Read, explore, move forward
Use a current Assortment Report XML and, ideally, your regular Heureka feed URL. One describes the market; the other helps identify your own products.
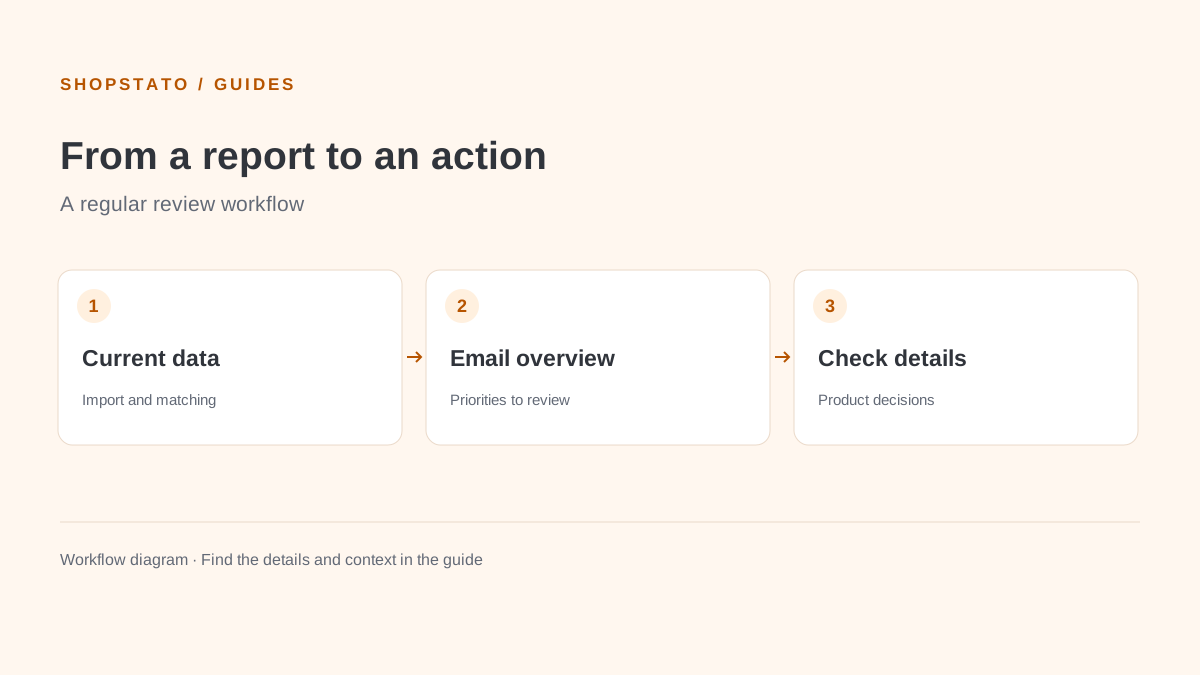
Start with the overview instead of individual products. Charts and the category tree help identify poor price positions, visibility or CPC.
An automatic email selects products needing attention. It can highlight prices above the market, a weaker position, high CPC or low popularity.
An activation email explains who receives the Heureka report and links to its settings. Adjust delivery to the people responsible for pricing and assortment.
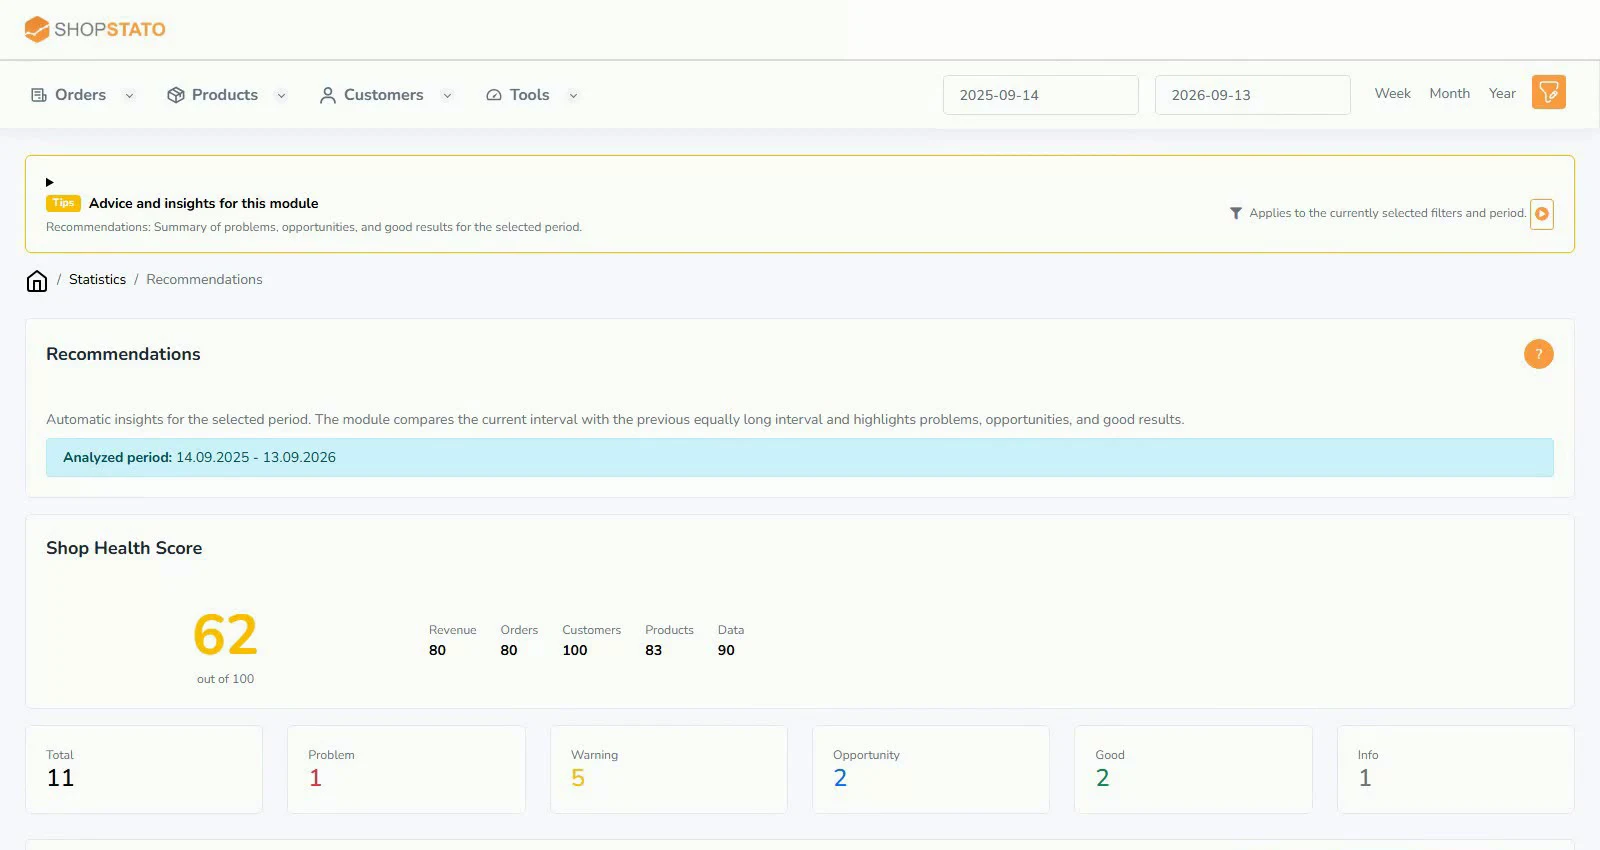
The weekly digest summarises key insights marked as problems over the last 30 days. It helps prioritise products, customers, shipping and payments.
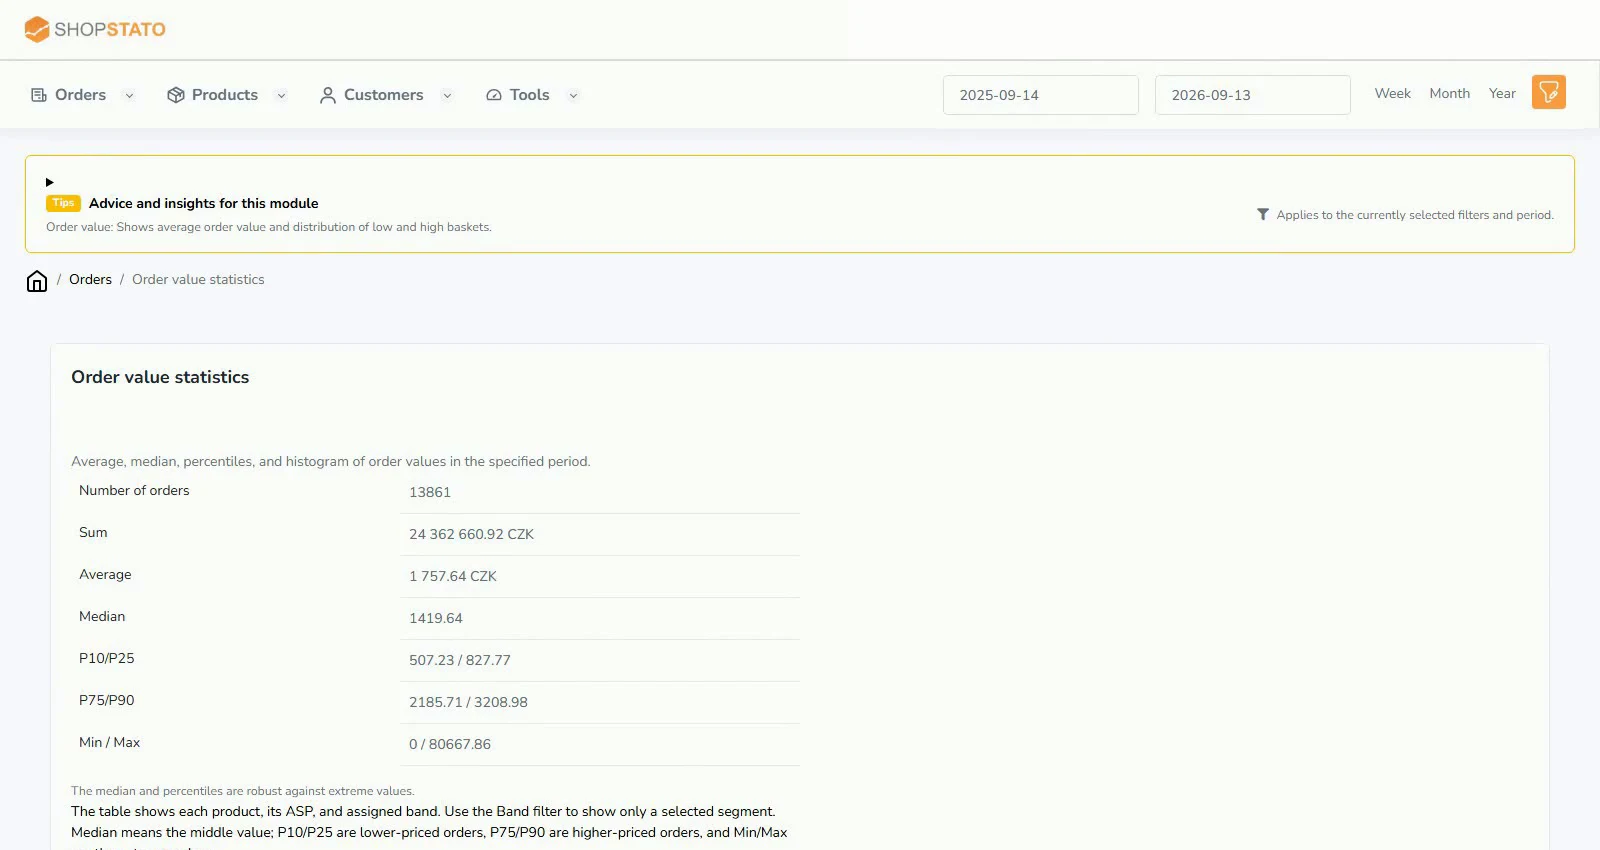
A few large purchases can shift average order value. The median, percentiles and histogram help show what a typical purchase looks like.
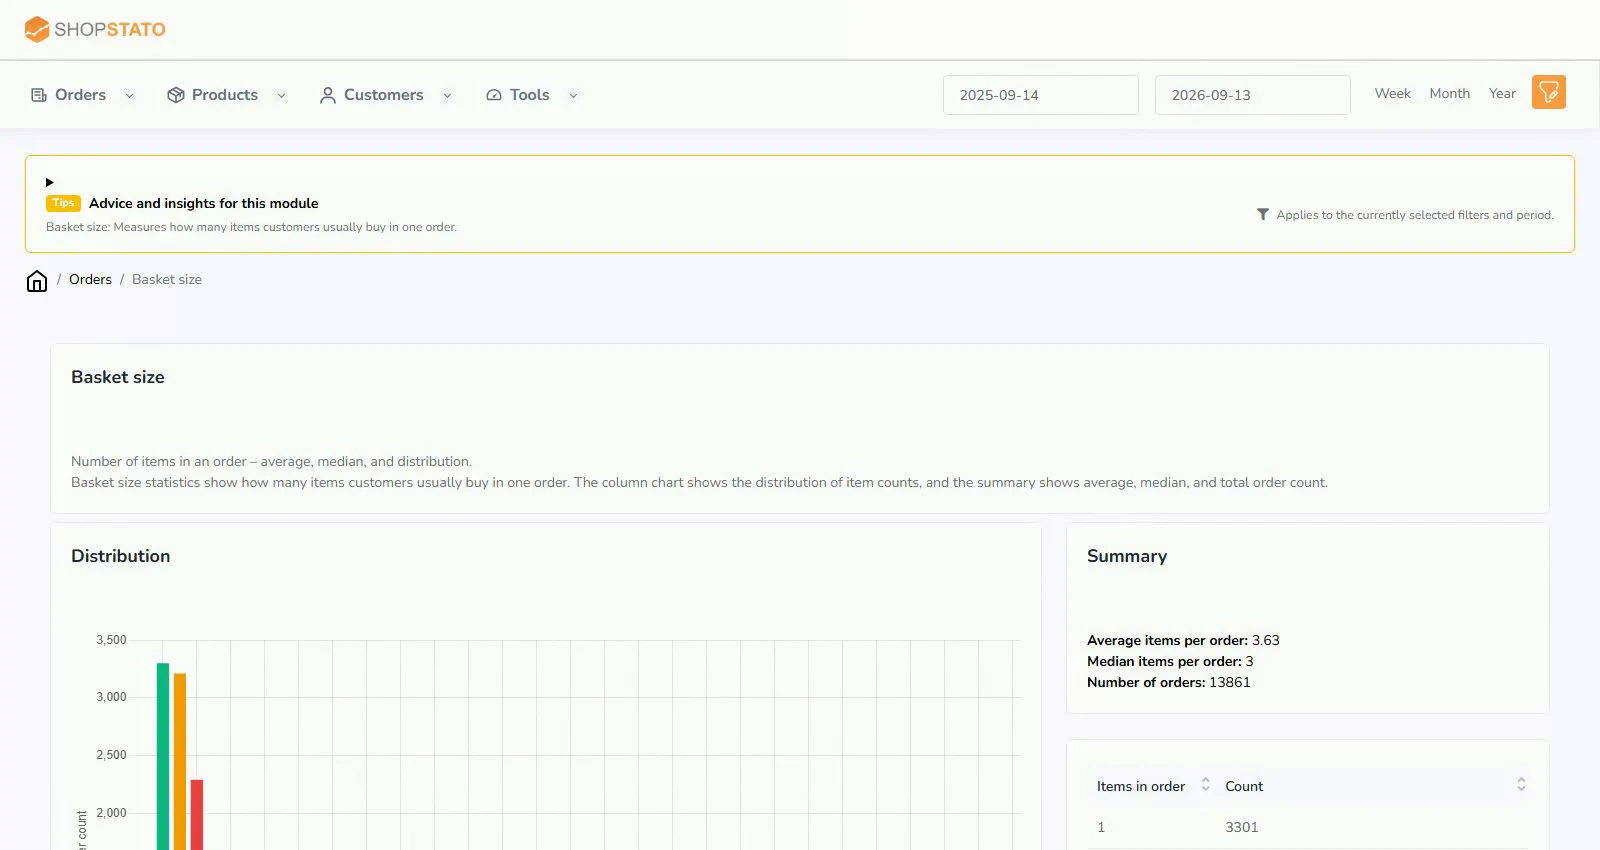
Order value and item count answer different questions. The basket report shows the average, median and distribution of items per order.
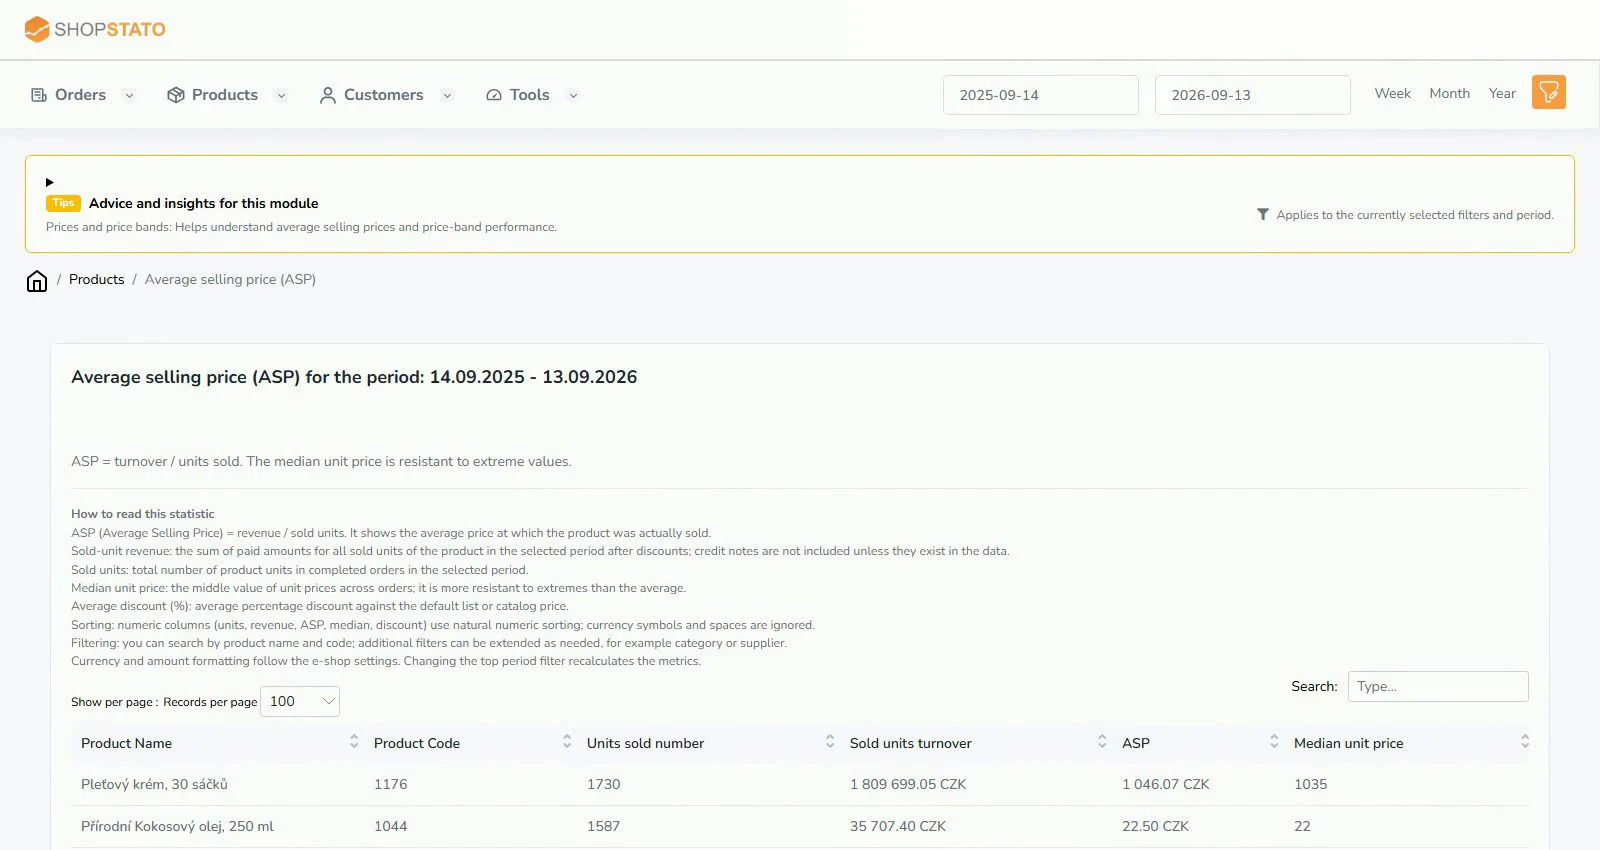
ASP is revenue per unit sold. It helps distinguish changes in sales volume from changes in prices and product mix.
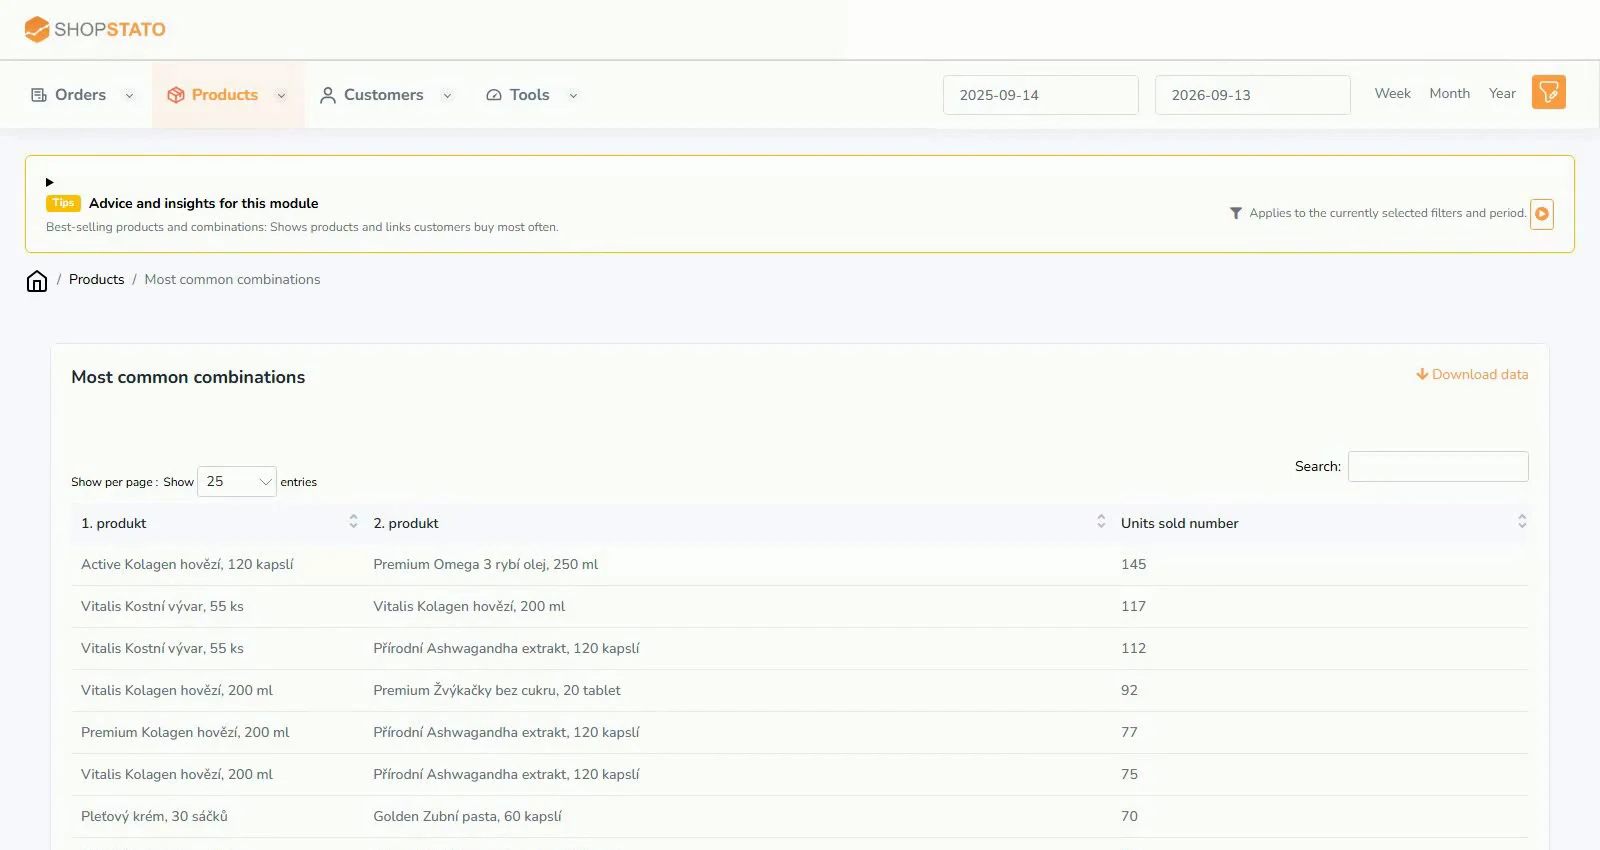
Joint purchase data helps find relevant accessories and follow-up offers. Attach rate adds context by showing how often a companion item appears with a selected product.
Start with your own data
Connect your store to Shopstato and see what your orders tell you.
All integration guidesYour next step
Explore your orders, products and customers in one place.