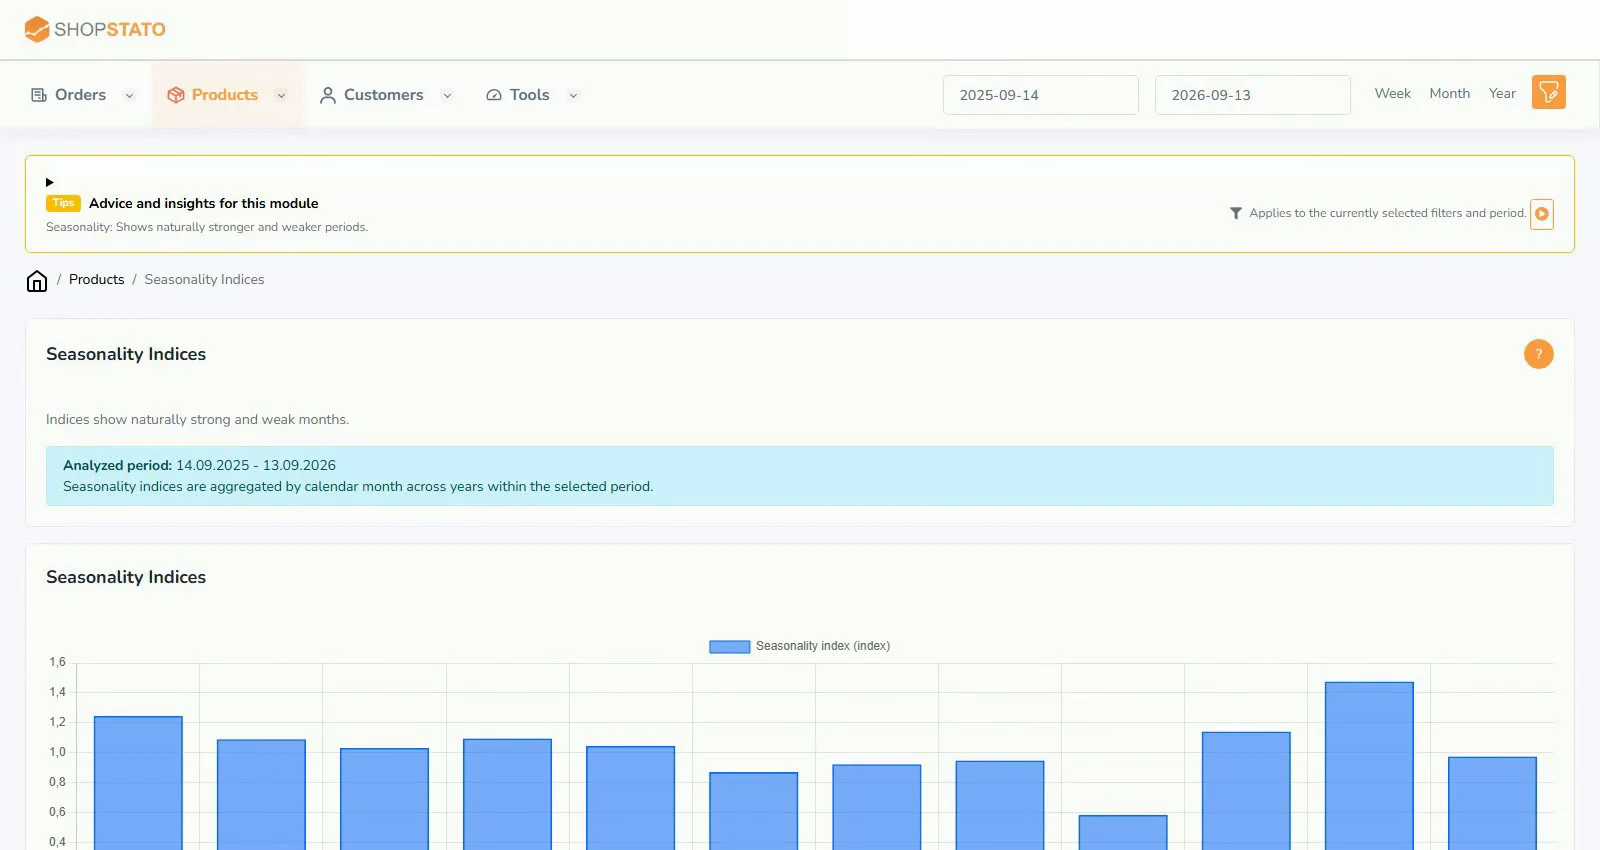
Seasonal indices: understand your store’s natural rhythm
Stronger and weaker months do not necessarily reflect a change in store quality. Seasonal indices show monthly deviations from long-term average revenue.
ModulesRead article
Ideas for your online store
Practical guides and context to help turn data into better decisions.
Read, explore, move forward
Stronger and weaker months do not necessarily reflect a change in store quality. Seasonal indices show monthly deviations from long-term average revenue.
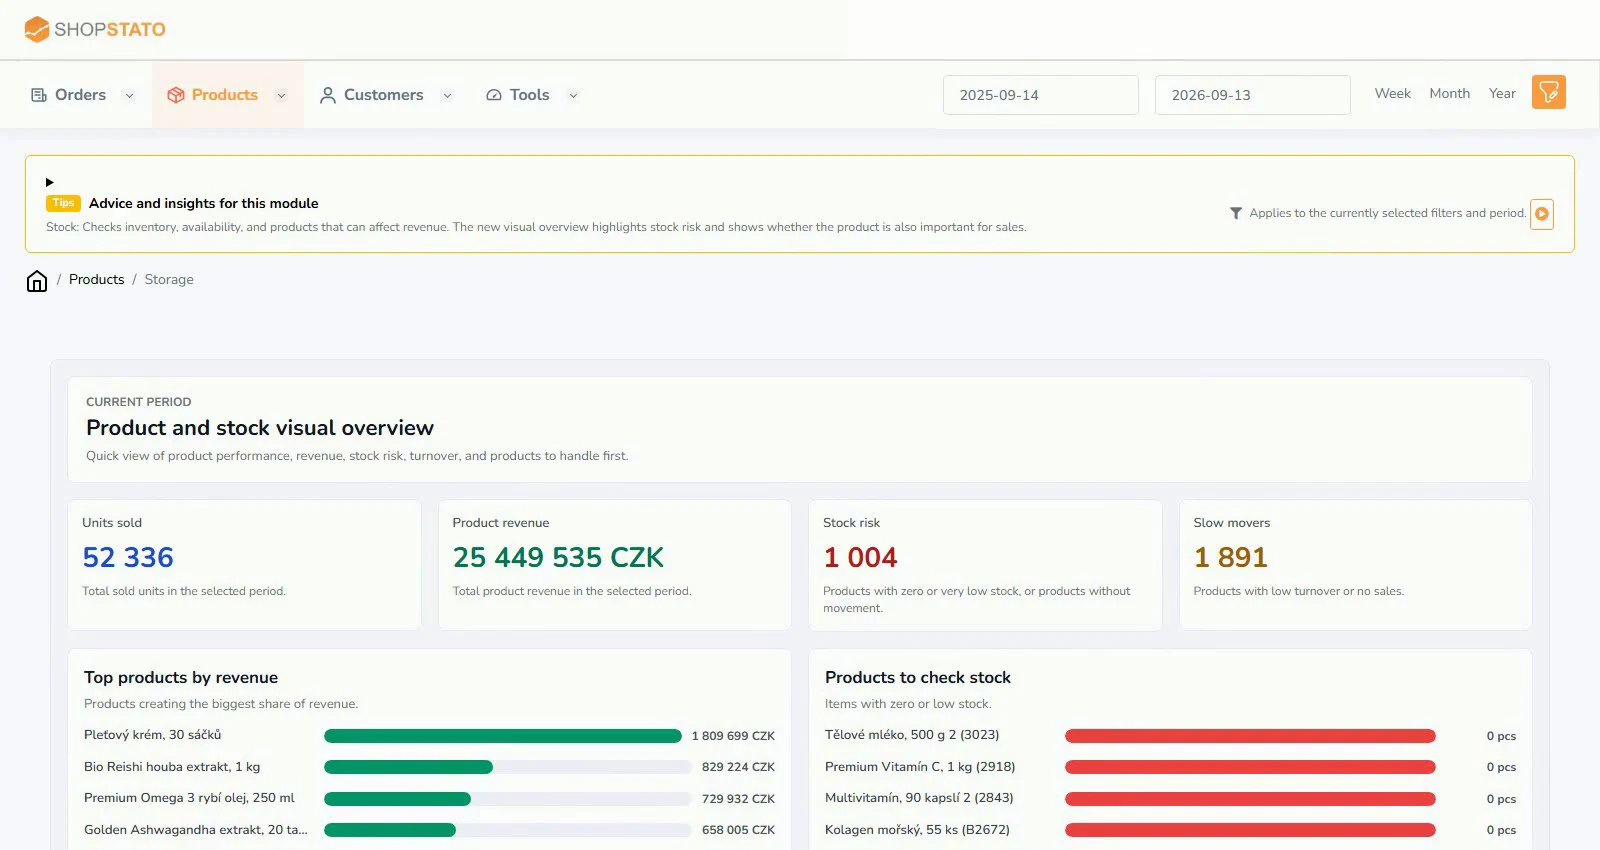
The inventory overview connects quantities, data freshness and stock changes. Find unavailable products, excess stock and items that have not sold for a long time.
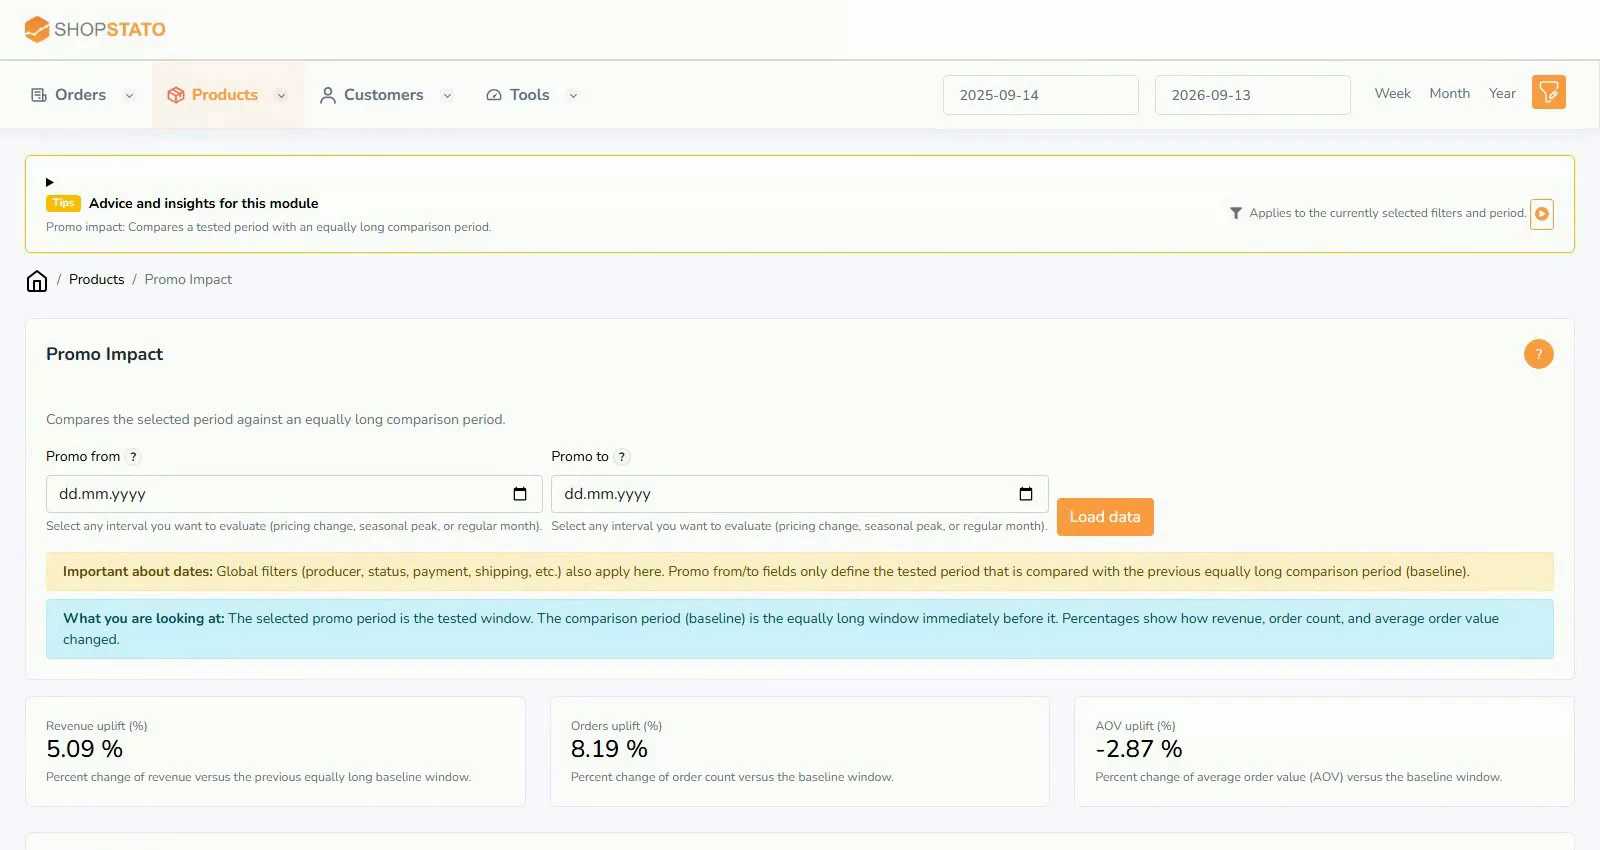
The promotion report compares a campaign with the immediately preceding period of equal length. Revenue, order count and AOV give context to the uplift.
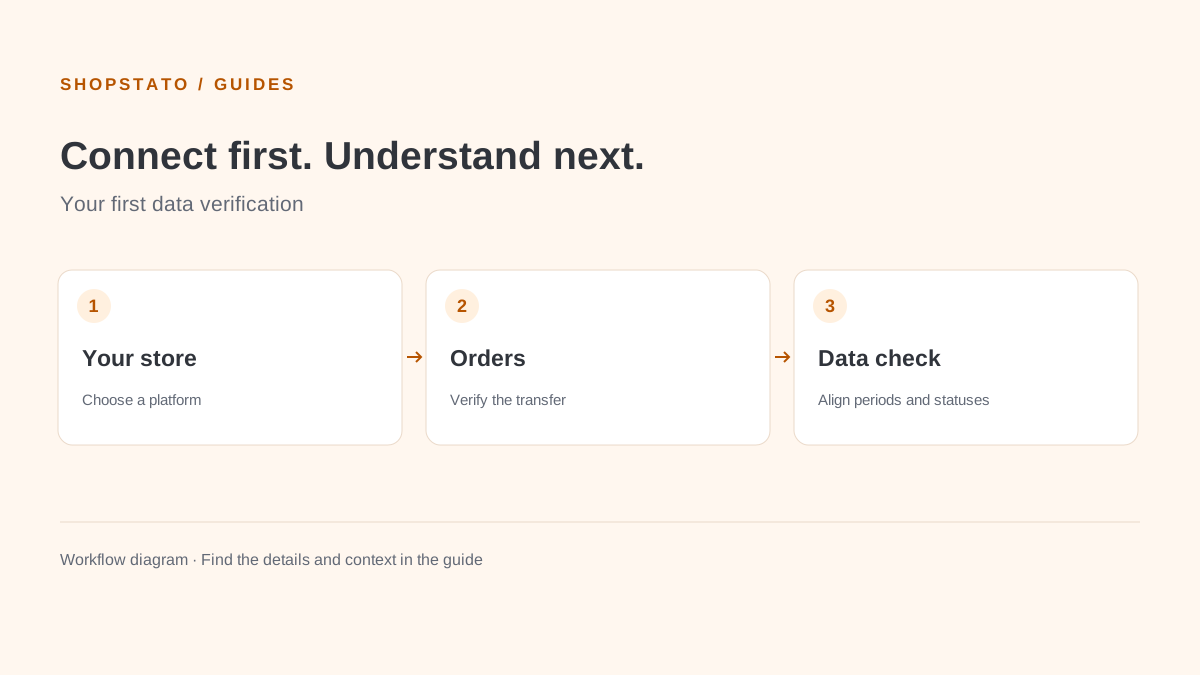
Good analysis starts with a reliable connection. Before reviewing profit or customer behaviour, check that Shopstato receives orders from the correct store.
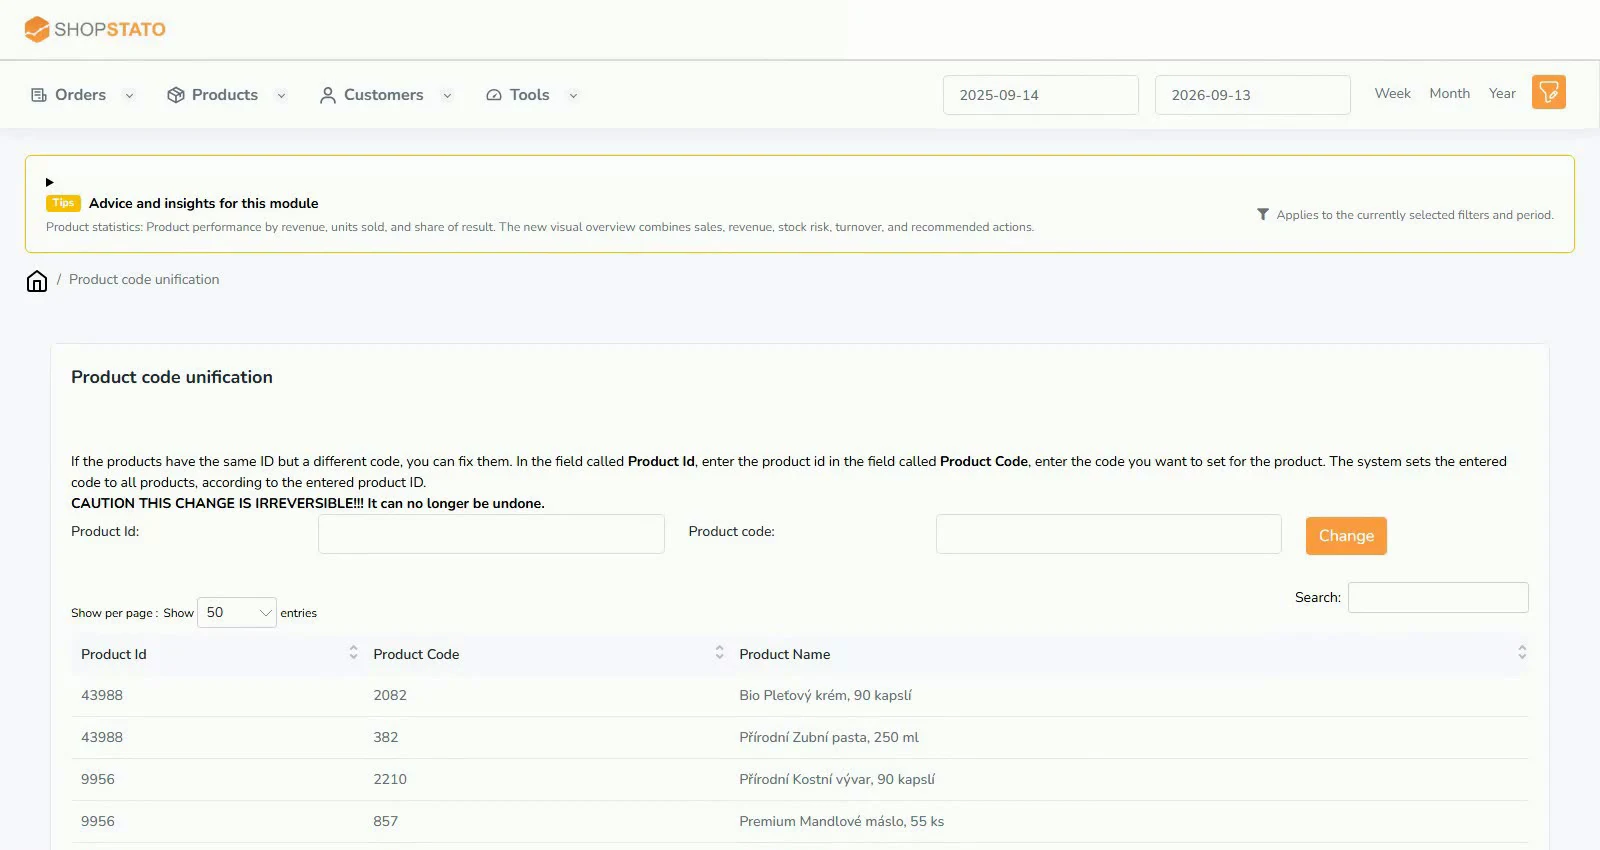
Several codes for the same product make matching sales and stock harder. Unifying codes by product ID connects records that belong together.
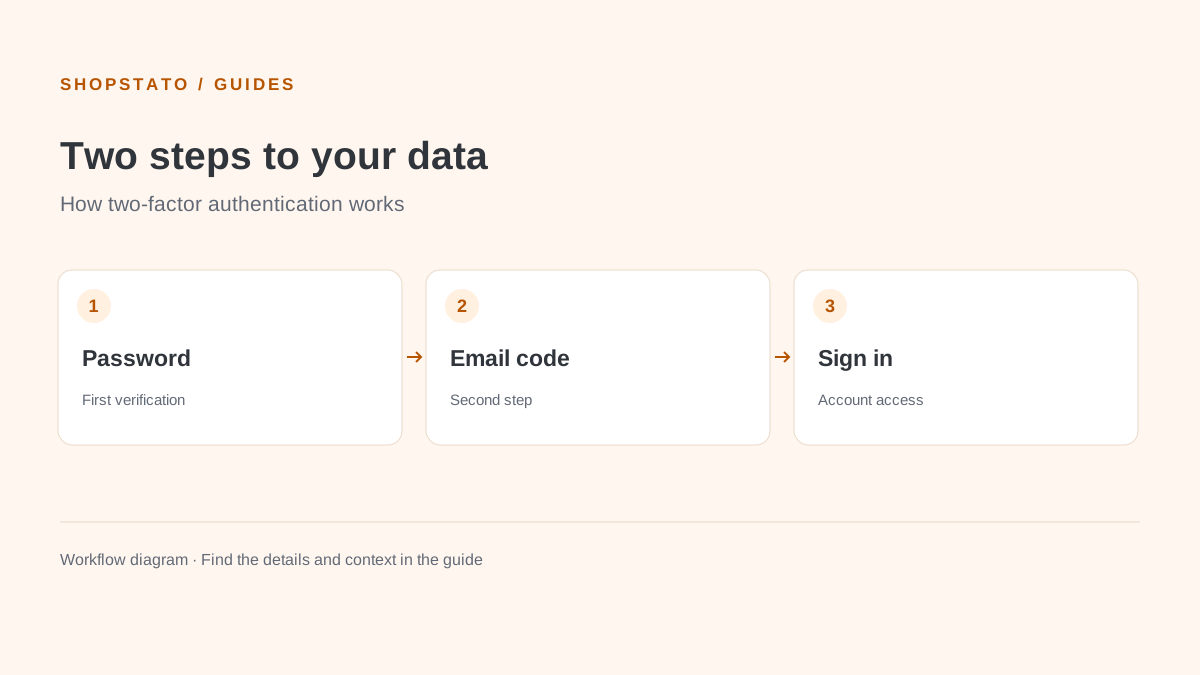
Add a one-time email code to your password. Two-factor authentication helps protect access to your business data if someone learns your password.
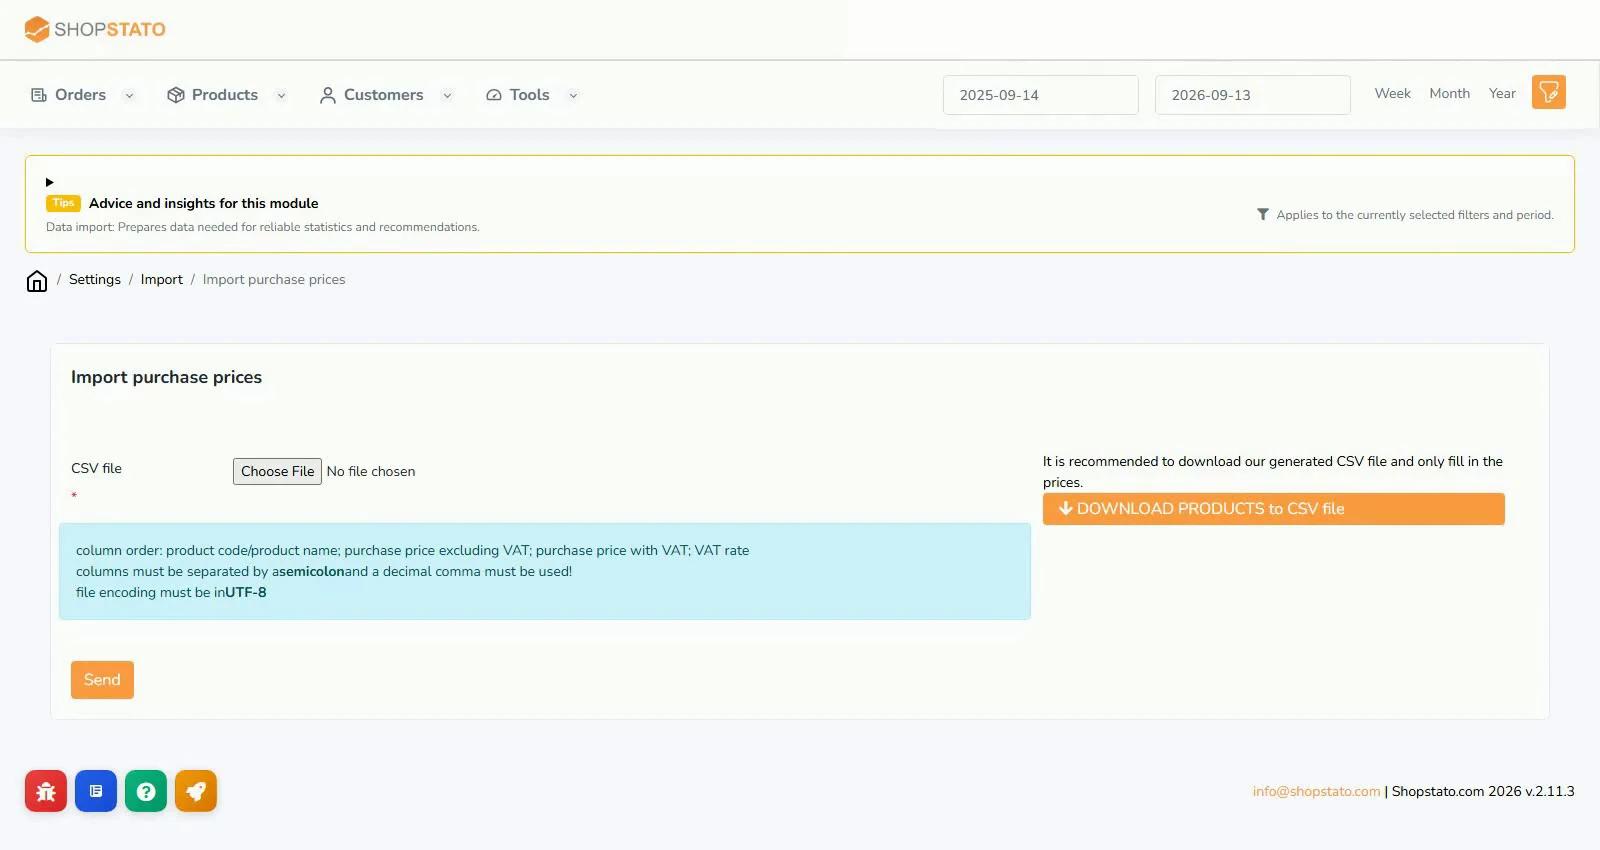
Revenue shows what customers bought. To calculate product profitability, Shopstato also needs purchase prices matched to your products.
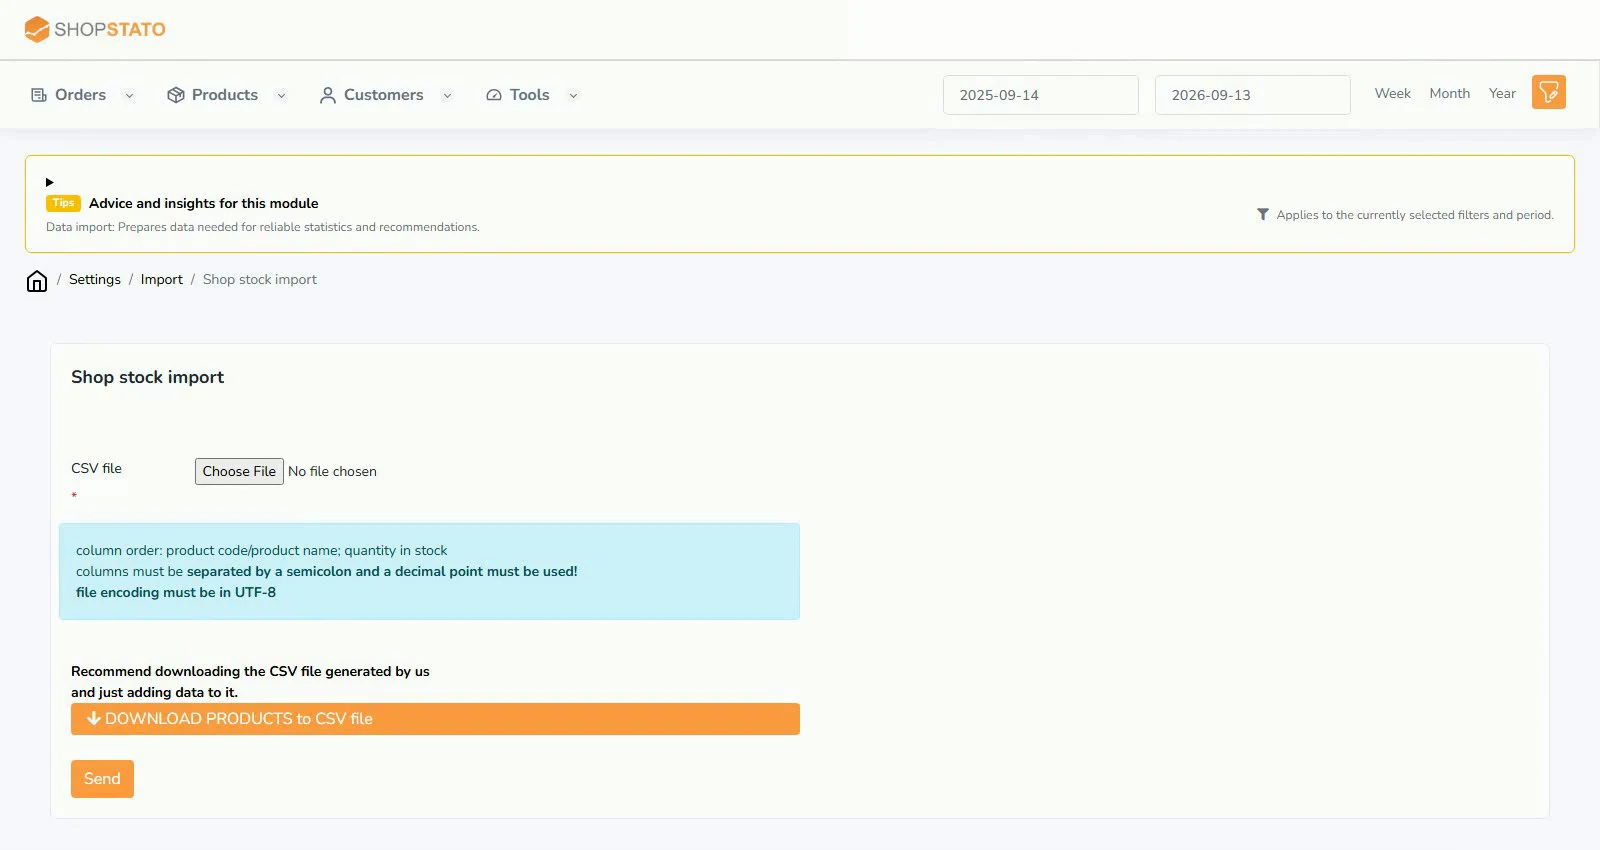
Current stock adds context to sales statistics. See which products sell and run low, and which remain on the shelf.
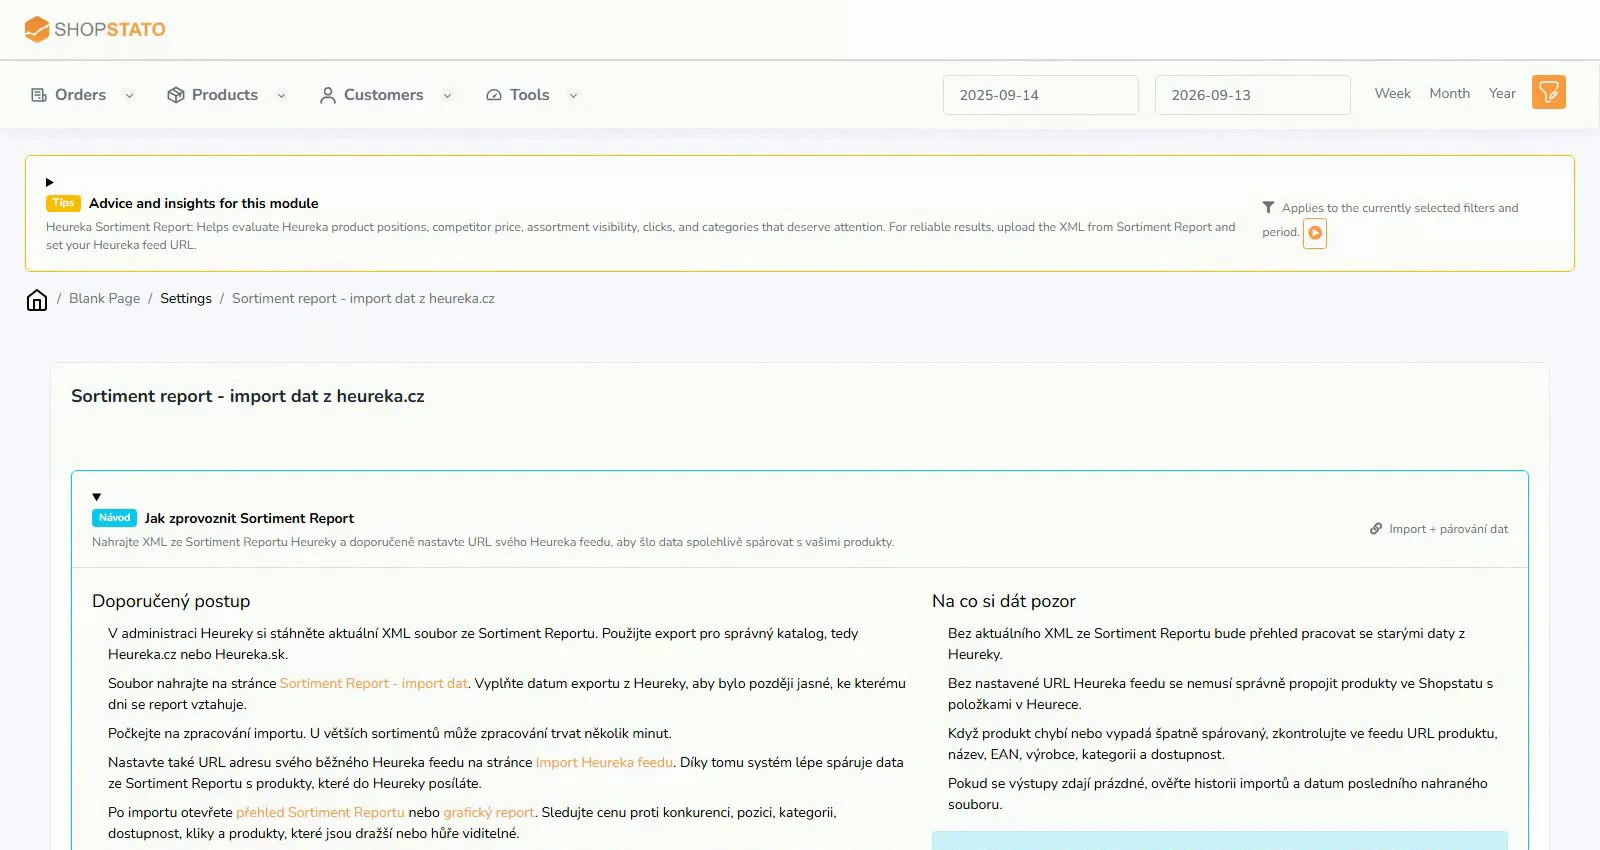
A Heureka XML export contains pricing and assortment data that Shopstato turns into product and category reports. Matching starts with a current export and accurate feed data.
Start with your own data
Connect your store to Shopstato and see what your orders tell you.
All integration guidesYour next step
Explore your orders, products and customers in one place.