ABC product analysis: a key to better optimisation
Fast delivery encourages stores to hold inventory. But stock also requires money, space and handling. To use those resources well, identify how much each product contributes to revenue.
ABC analysis is inspired by the Pareto principle: a relatively small share of causes can account for a large share of results. In a store, that means a small part of the assortment may generate much of the revenue. It is a useful pattern rather than a guarantee that every store has exactly the same proportions.
Three groups, different priorities
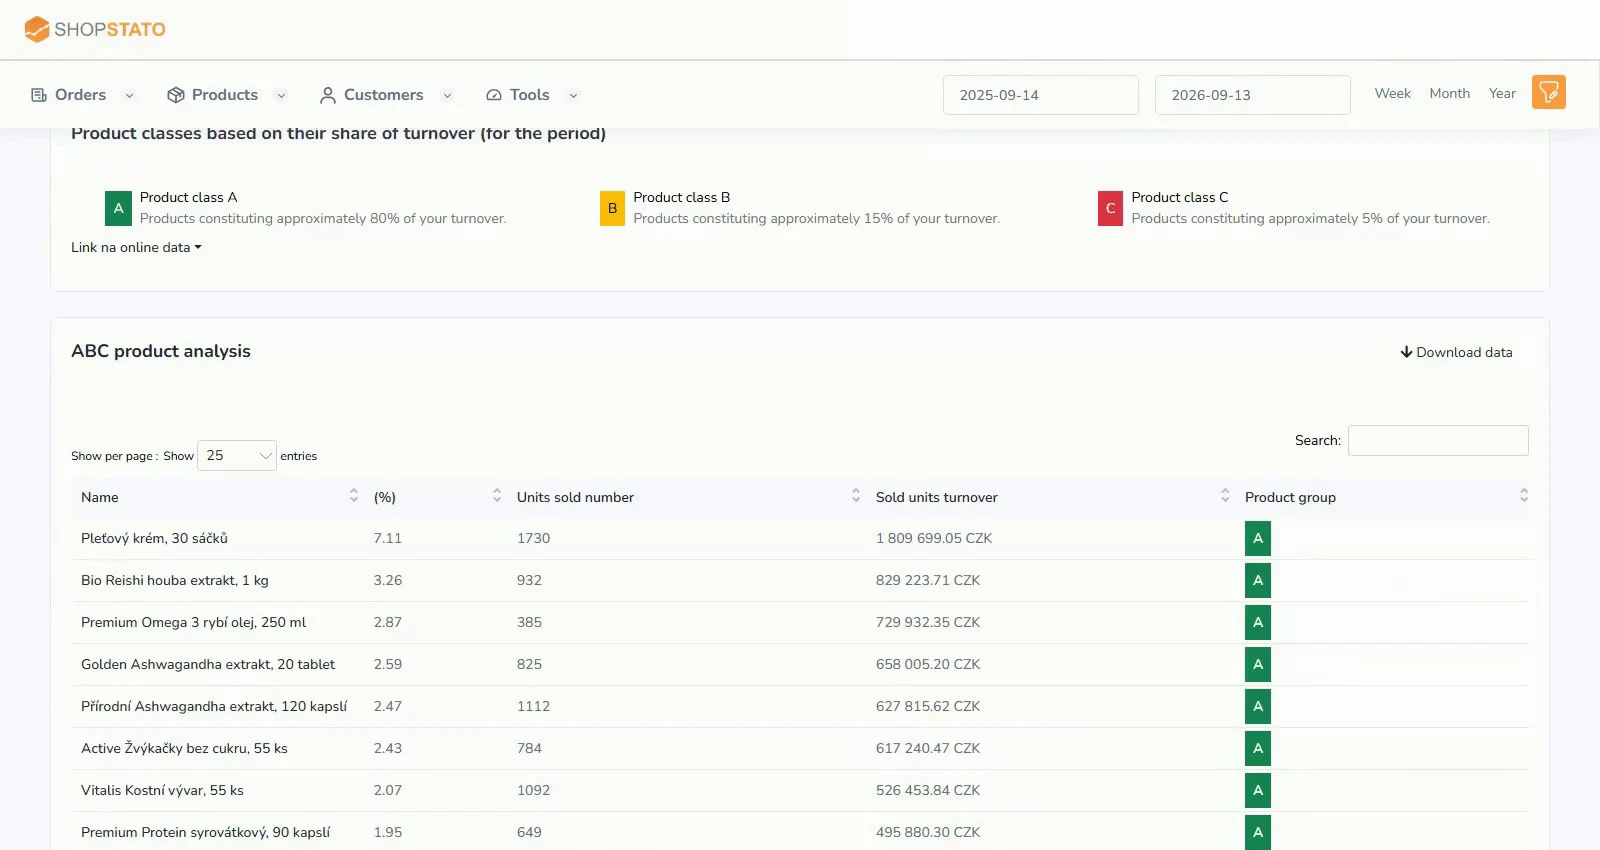
- Group A: products contributing roughly 80% of revenue in the illustrative split. These are key items whose availability deserves attention.
- Group B: the next roughly 15%. Follow trends and identify products with potential to become more important.
- Group C: the remaining roughly 5%. Review the space, capital and attention they require.
These percentages describe revenue shares, not fixed proportions of product counts. Use the actual groups and settings shown in your report.
Use the ranking in context
Keep important sellers available, monitor developing products and investigate slow inventory. Group C does not automatically mean a product should be removed: it may be a new item, a seasonal item or a useful accessory.
Revenue alone also says little about margin. Combine the ranking with purchase prices, profitability, stock and turnover before placing an order.
Continue with the ABC guide or the article on working with each group.